Overhead costs now shape your Profitability Report — with a full margin ladder
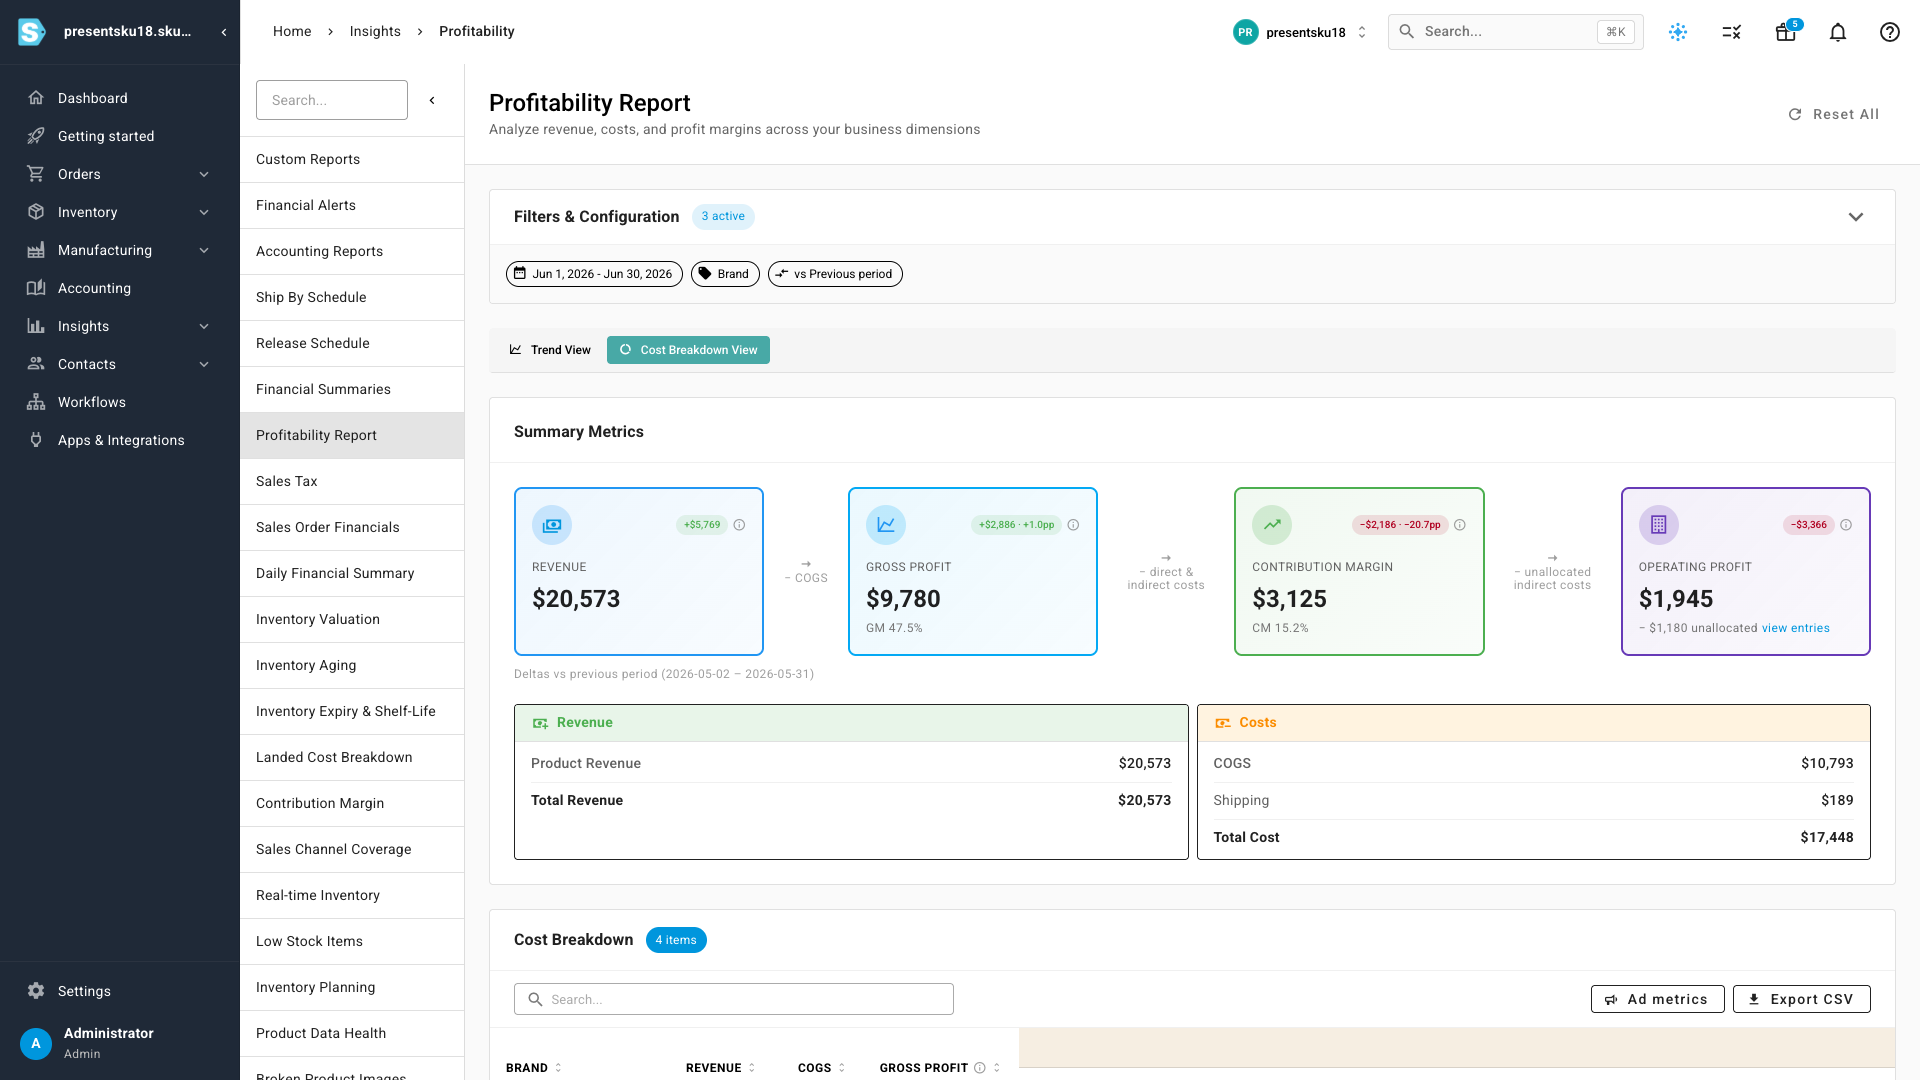
You went to the trouble of entering your marketing spend, 3PL fees, software subscriptions and Amazon storage costs, and allocating them to the right products and brands — but your Profitability Report acted like none of it existed. It stopped at gross profit, so a brand that looked healthy on paper could be underwater once its share of overhead landed. The Profitability Report now includes the cost entries you allocate — every marketing campaign, fee and overhead cost folds into the report as a distinct, auditable cost line, and the bottom line becomes a full margin ladder: Revenue → Gross Profit → Contribution Margin → Operating Profit.
✨ What this means for you:
- See true profitability, not just gross margin — your allocated marketing, fees and overhead are now subtracted right in the report, so the profit number reflects what you actually keep.
- An industry-standard margin ladder — Gross Profit, Contribution Margin and Operating Profit are named exactly as your accountant expects, with the percentages alongside each.
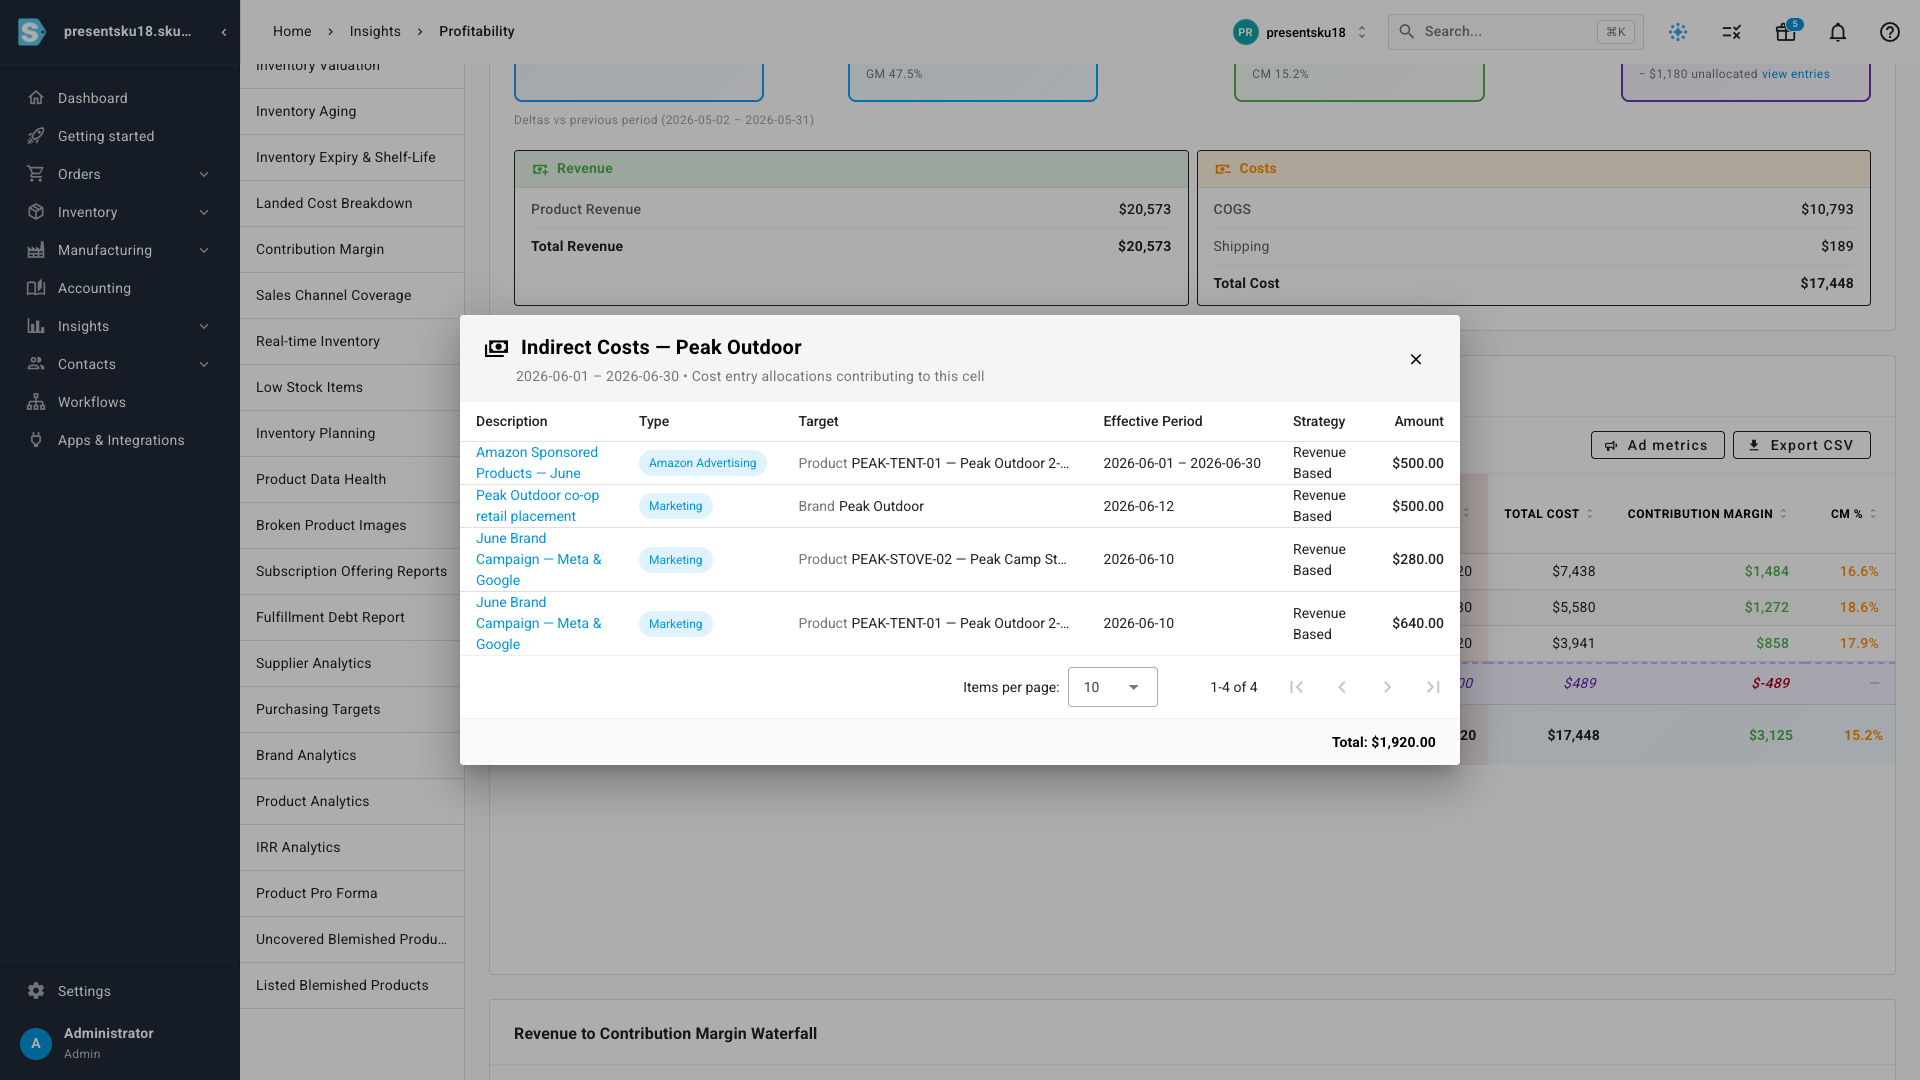
- Every number explains itself — a click shows the exact cost entries behind any figure, so there are no mystery numbers.
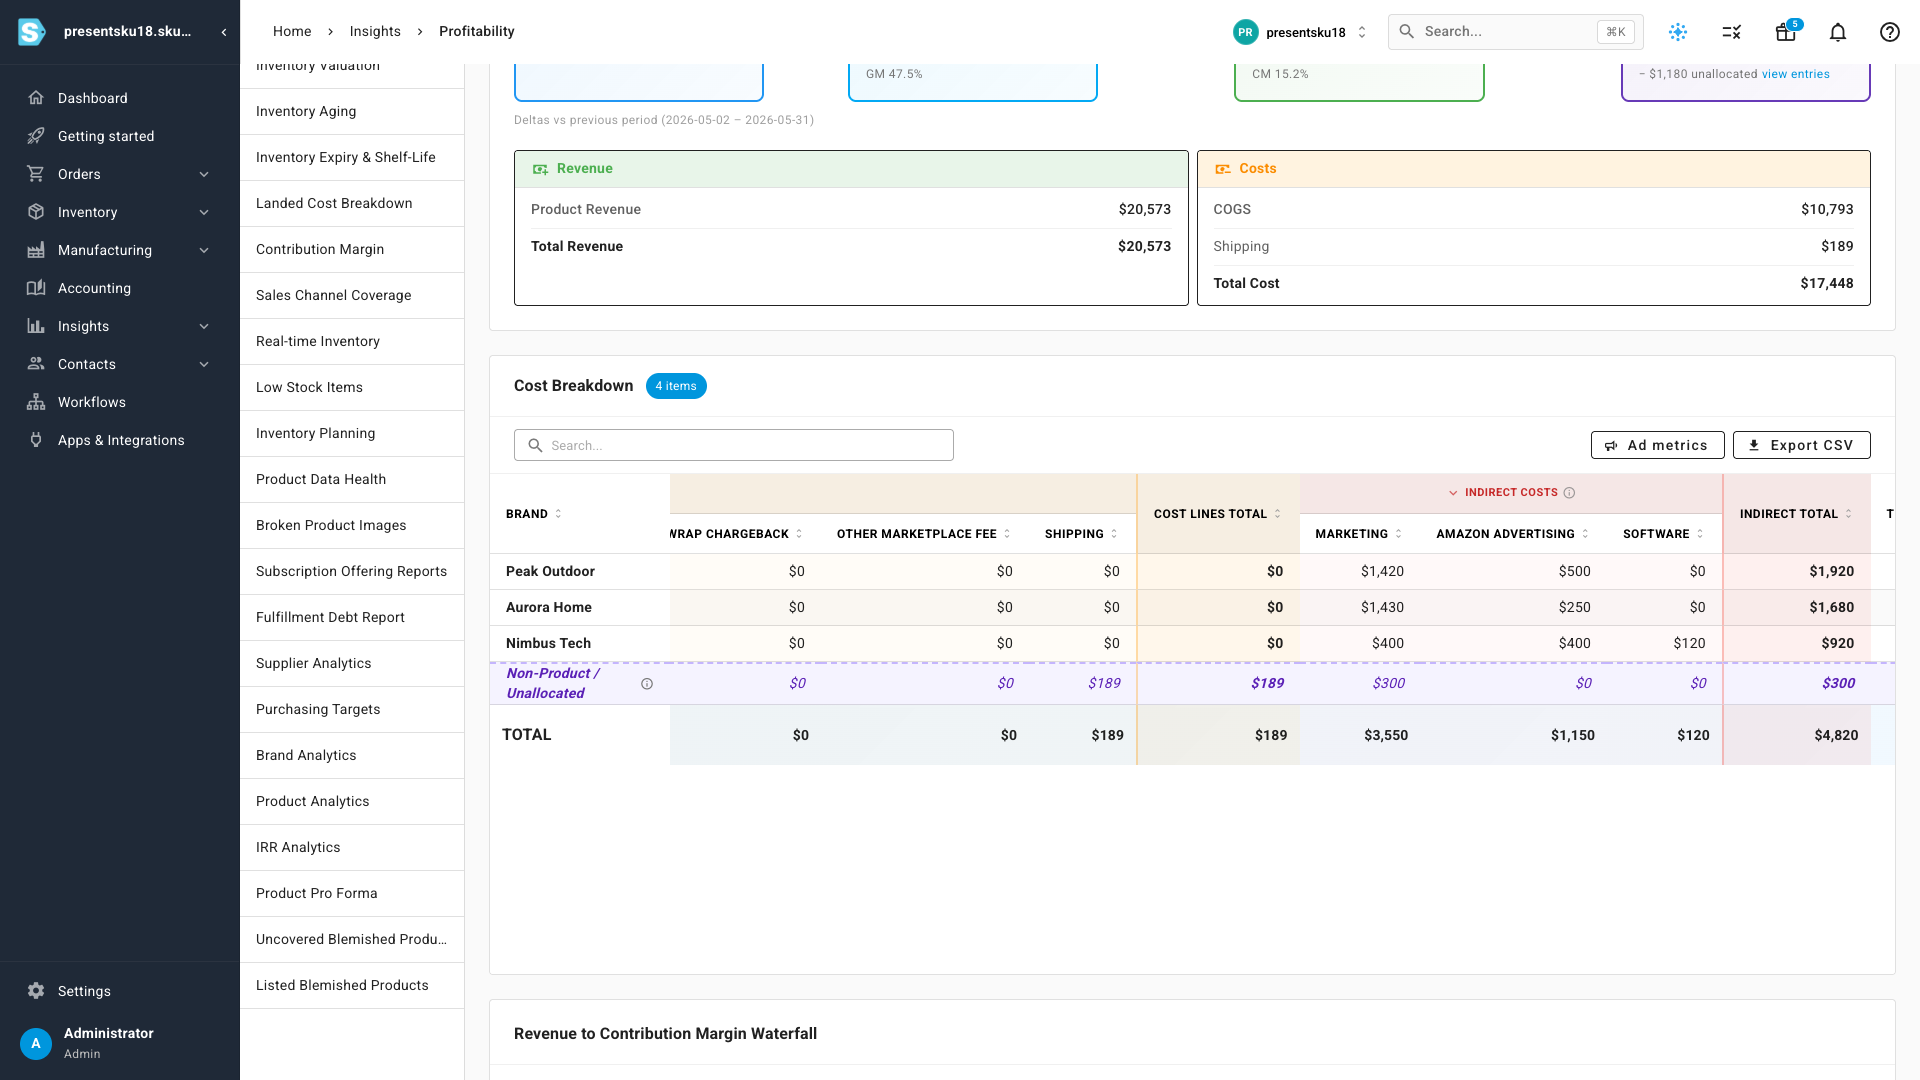
- Overhead broken out by type — see marketing vs advertising vs software as their own columns, per brand, SKU or supplier.
- Compare against last period — each figure carries a change chip versus the previous period or prior year.
A margin ladder, from revenue to operating profit
The summary now reads as a ladder. Start with Revenue, subtract COGS to get Gross Profit, subtract your direct and indirect costs to get Contribution Margin, then subtract the overhead you haven't tied to a specific product to get Operating Profit — the company-level bottom line. Each tile shows the dollars and the margin percentage, and a small change chip tells you how it moved versus the period before.
Overhead, broken out by cost type
In the Cost Breakdown view, your allocated overhead appears as an Indirect Costs column that folds into total cost and contribution margin. Expand it and it splits into a column per cost type — Marketing, Amazon Advertising, Software and any type you've created — for every brand, SKU or supplier. Costs that can't be tied to a specific row (a brand-wide fee, or a cost allocated to a product with no sales this period) roll into a clearly labelled Non-Product / Unallocated line, so the totals always add up.
Click any figure to see exactly where it came from
No figure is a black box. Click the indirect cost on any row and you get the exact cost entries behind it — the campaign or fee, its type, what it was allocated to, the effective period and the amount — and the list totals to the cell you clicked. The Operating Profit tile does the same for the overhead that hasn't been allocated yet, each row linking straight to its cost entry.
Down to the individual order — and your profit alerts
The same overhead is prorated down onto individual sales orders, so an order's Profit tab now shows its contribution profit — the order's profit after its share of allocated overhead — right beneath the usual profit figure. And if you turn it on in your financial-alert settings, profit alerts can watch contribution margin instead of raw profit, flagging orders that only look profitable before overhead is applied.
Where to find it
Open Insights → Reports → Profitability Report. Everything is on by default — pick your date range and dimension and click Generate. Use the Include indirect costs toggle to compare margins before and after overhead, and the per-order contribution profit shows on any sales order's Profit tab.