Custom Report Builder — answer any data question without a developer
Every business has that one question the standard reports can't quite answer — "on-hand value by product this month", "revenue by channel and brand", "which SKUs are moving and what are they worth". Until now, answering it meant exporting to a spreadsheet or asking someone to build a report for you. The new Custom Report Builder lets you answer those questions yourself: pick the data, drag the fields you care about, and get a live table, chart, or pivot in seconds — no spreadsheets, no waiting.
✨ What this means for you:
- Build reports across Sales, Inventory, Purchasing, Financial, Returns, Logistics, and Integrations — all in one place.
- Drag and drop dimensions and measures into rows, columns, and values — or just ask in plain English and let SKU build it for you.
- Flip the same result between table, chart, and pivot without re-running anything.
- Add your own calculated columns with a guided formula editor and live validation.
- Save, share, and schedule reports so the numbers you care about arrive automatically.
Start with any corner of your business
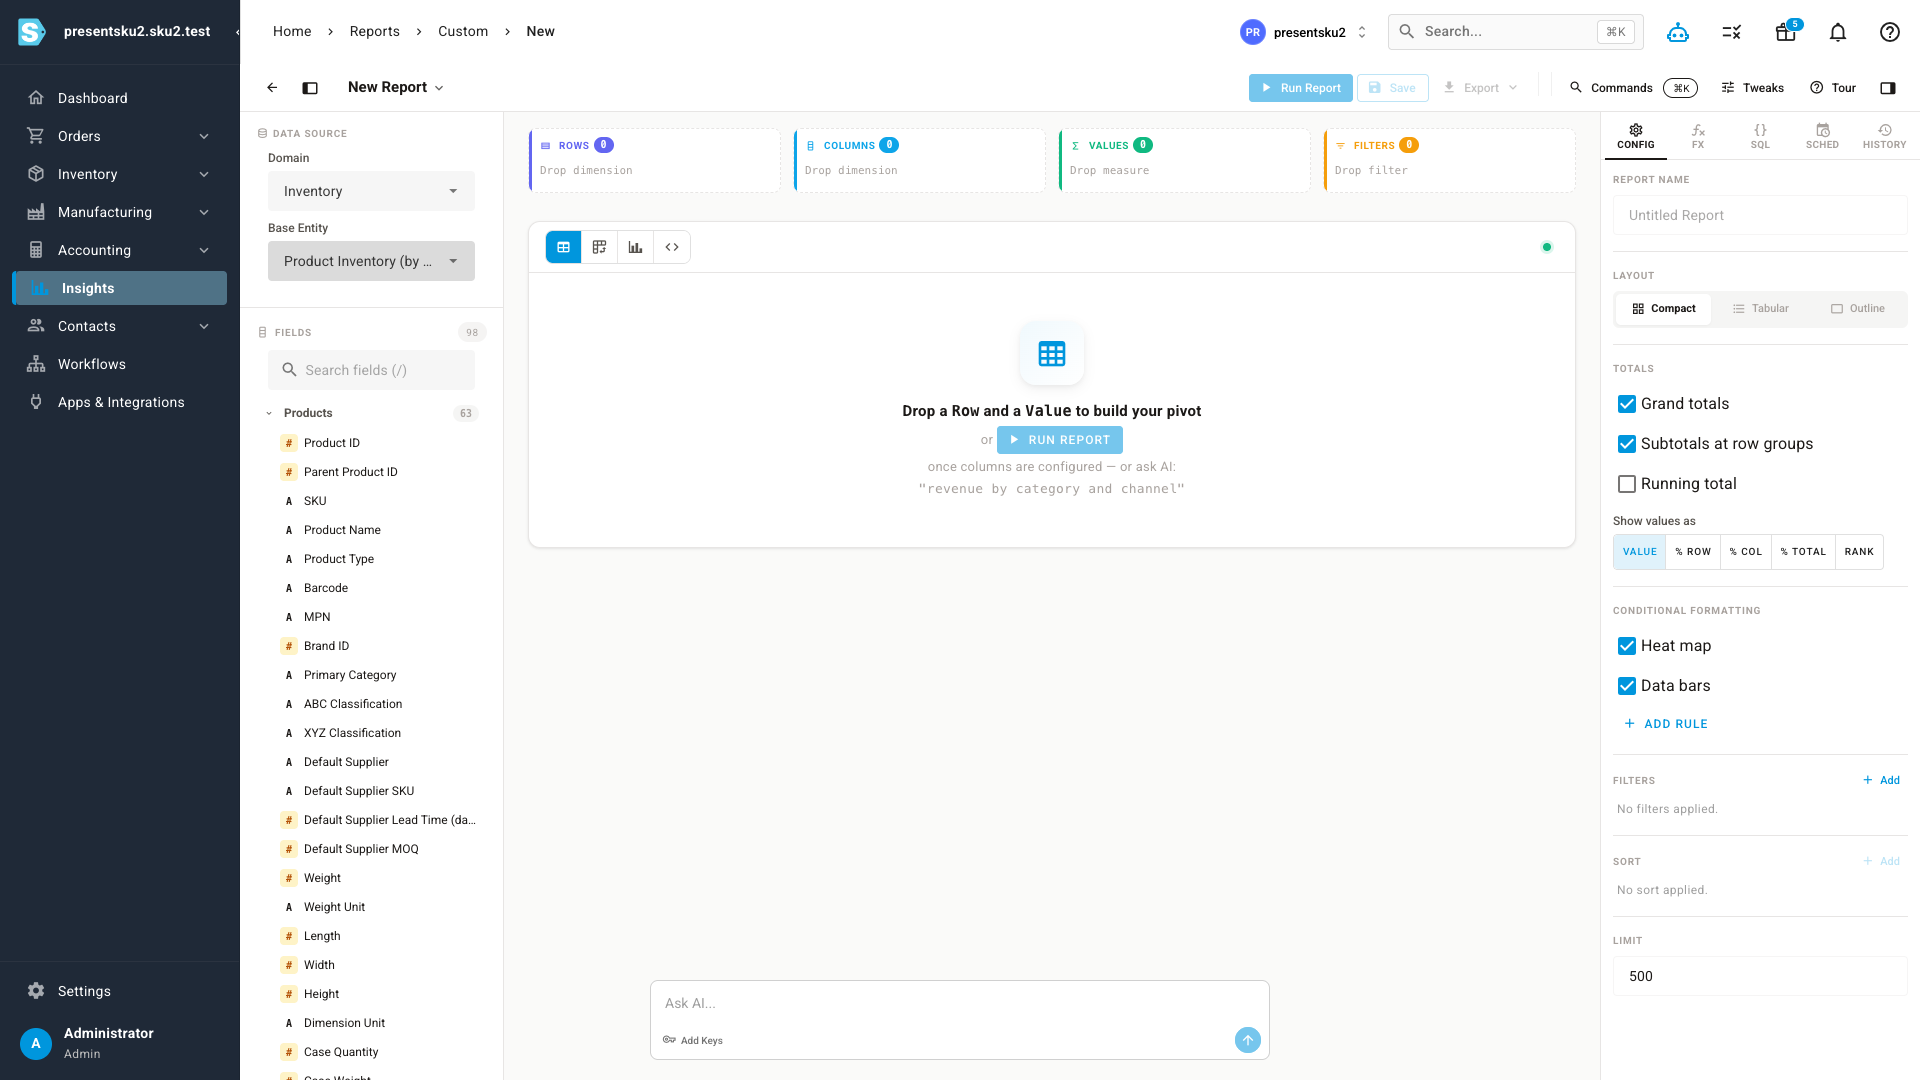
Pick a domain — Sales, Inventory, Purchasing, Financial, and more — then a starting table, and SKU opens a searchable catalog of every field you can report on, complete with plain-English descriptions so you always know what a field means. Blue fields are things you group by; orange fields are numbers that add up.
Build it by dragging — or just ask
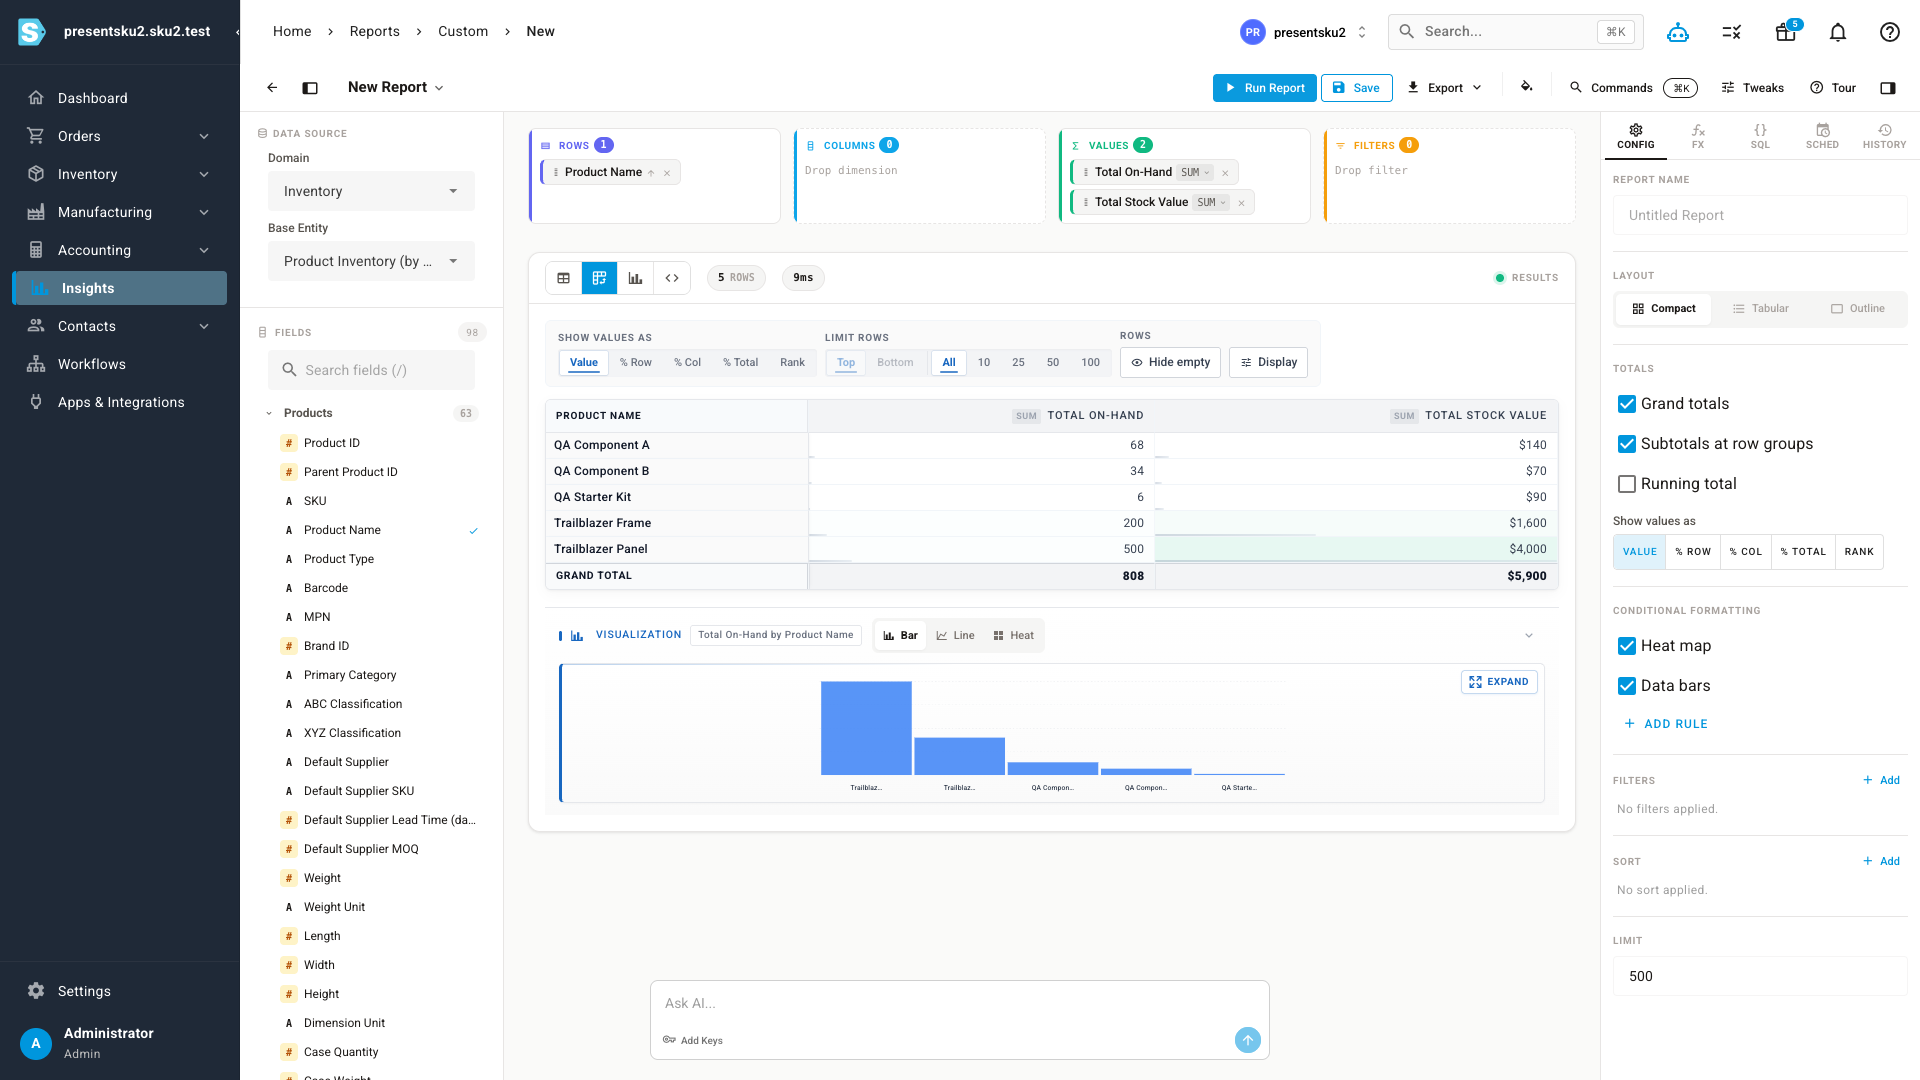
Drag fields onto the Rows, Columns, Values, and Filters shelves to shape your report. Measures aggregate automatically (sum, average, count, and more), and grand totals and subtotals are on by default. Prefer to skip the setup? Type what you want into the Ask AI bar — "on-hand value by product", "revenue by category and channel" — and SKU assembles the report for you to fine-tune.
See it as a table, chart, or pivot — instantly
Run the report and the results come back with totals, heat-map shading, and data bars built in. Switch between table, pivot, and chart views with one click — the same data, visualized the way you need it — and reshape on the fly with options like show values as % of total, rank, and top / bottom N.
Add your own calculated columns
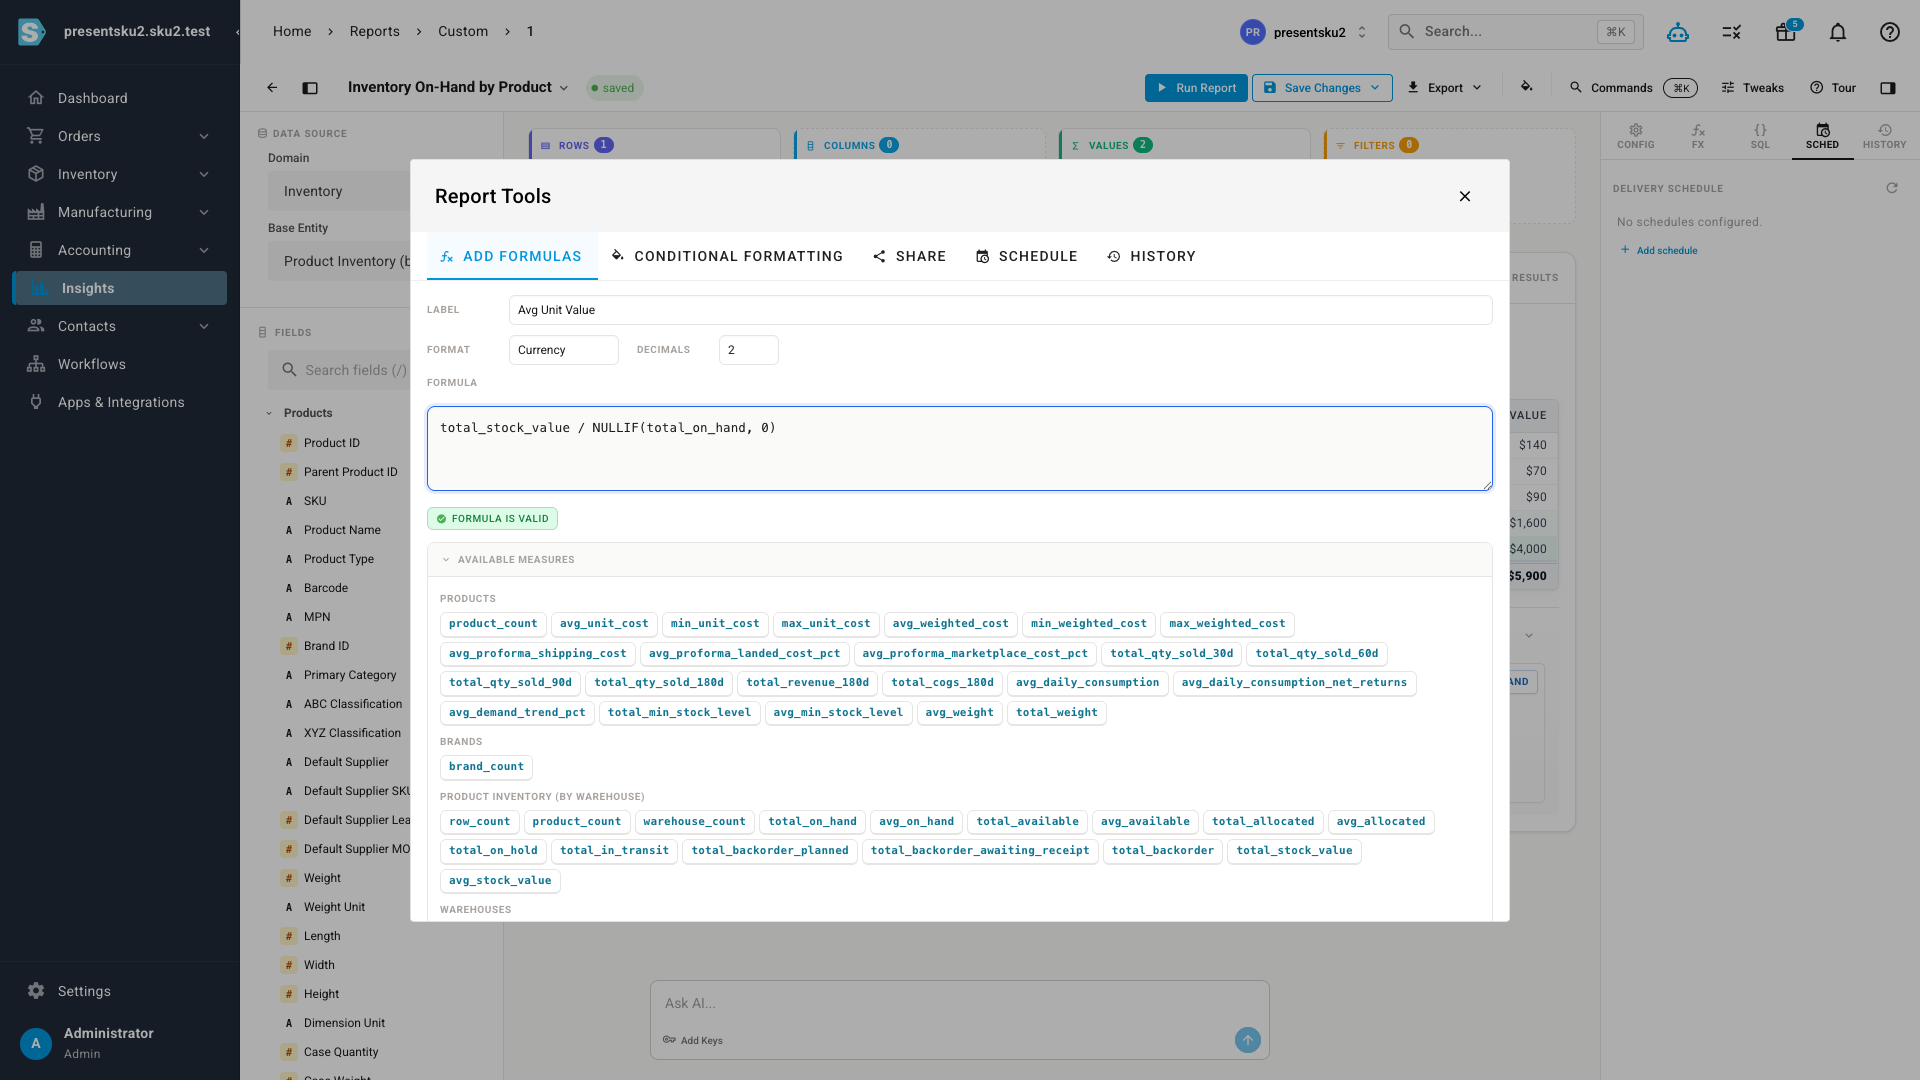
Need a number that isn't in the data yet — average unit value, margin %, revenue per unit? Open the formula editor, give your column a name and format, and write an expression using a catalog of available measures and supported functions. SKU validates it as you type, so you know it's right before you add it.
Save, share, and schedule
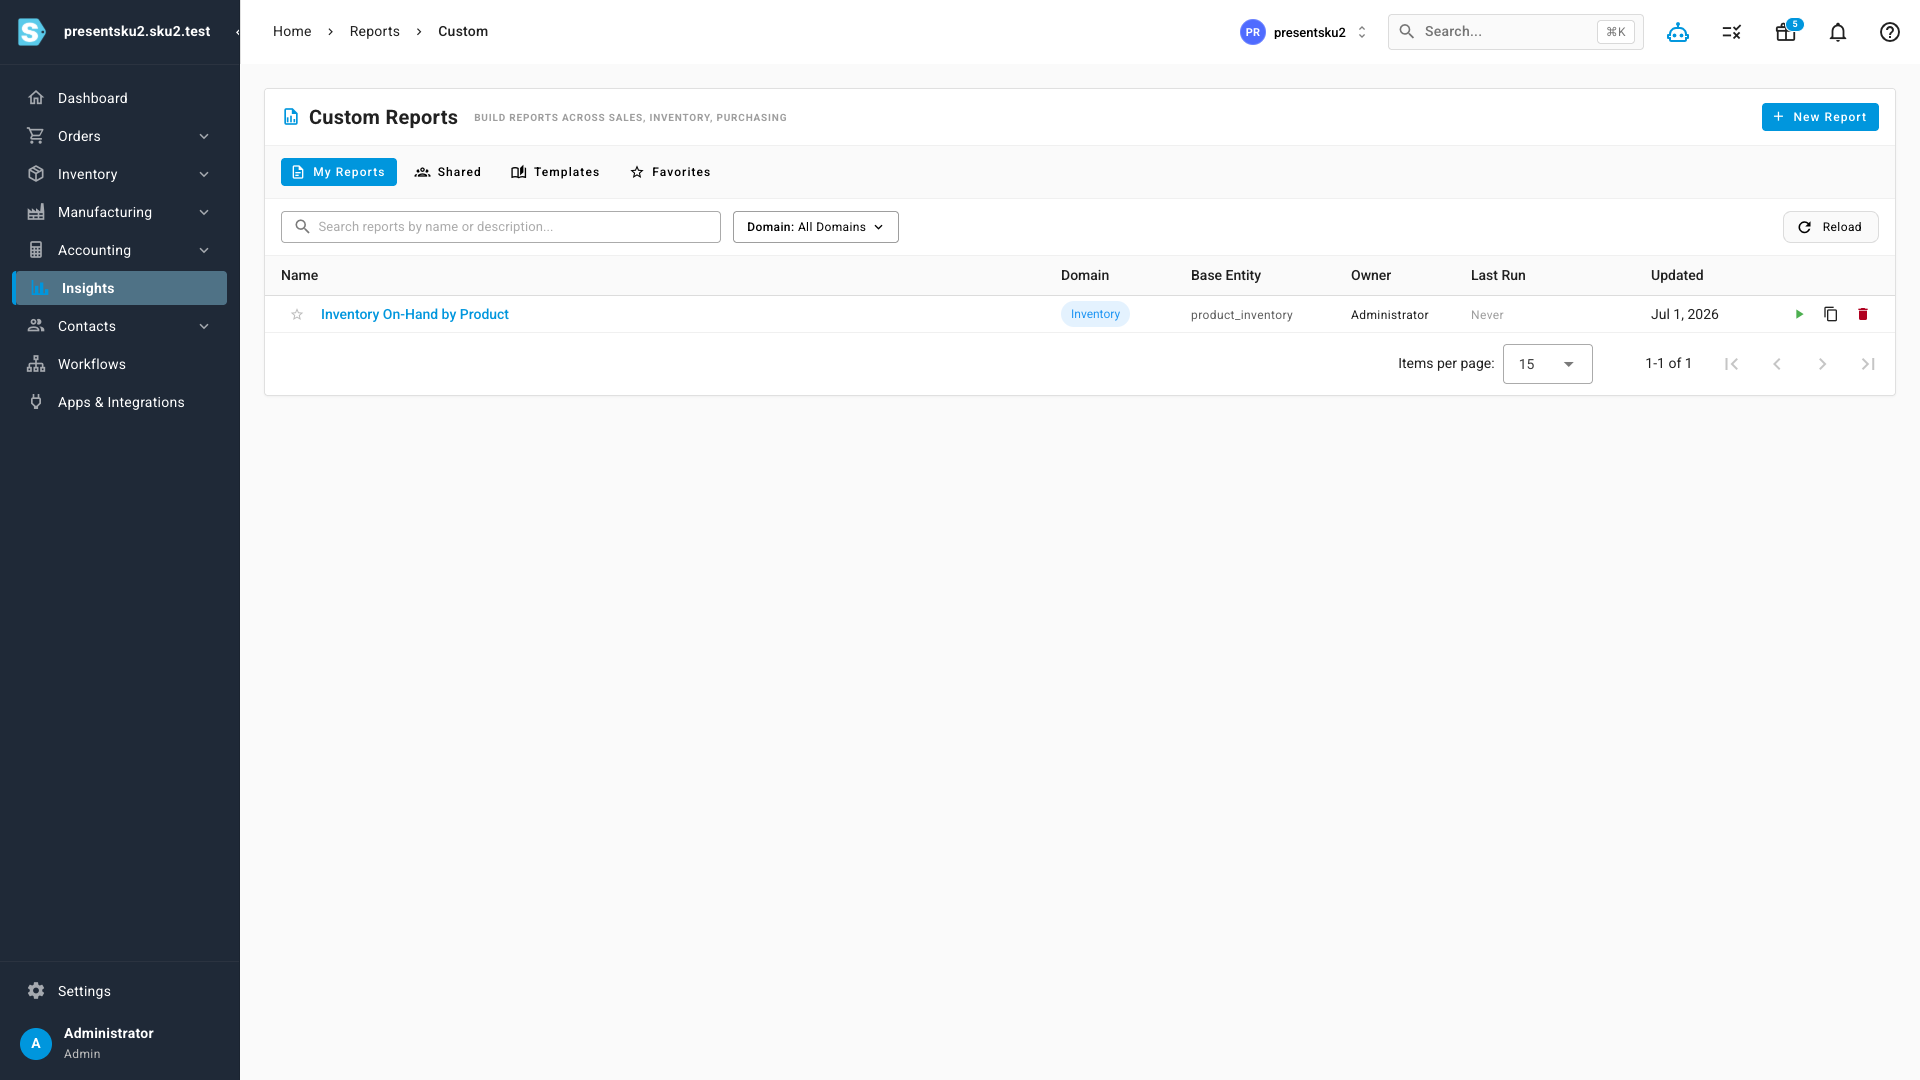
Save a report to your library and it's a click away next time. Share it with your team, or set up a schedule so it's delivered automatically on a recurring basis — no more remembering to pull the numbers each week.
Where to find it
Head to Insights → Reports → Custom in the main navigation, then click New Report to start from scratch — or open one you've already saved.