Forecast confidence — know which reorder numbers to trust, and prove why
Your demand-planning forecast has always given you a reorder quantity — but not a way to tell whether that number was built on two years of steady sales or two days of noise. A brand-new SKU with almost no history looked exactly as authoritative as a proven bestseller, and once you exported the results, the reasoning behind each number disappeared. Forecast confidence fixes that: every recommendation now carries a confidence level, a likely range around the quantity, and a plain-English explanation of how it was calculated — right in the results table, in the calculation detail, and in the export you hand to finance.
✨ What this means for you:
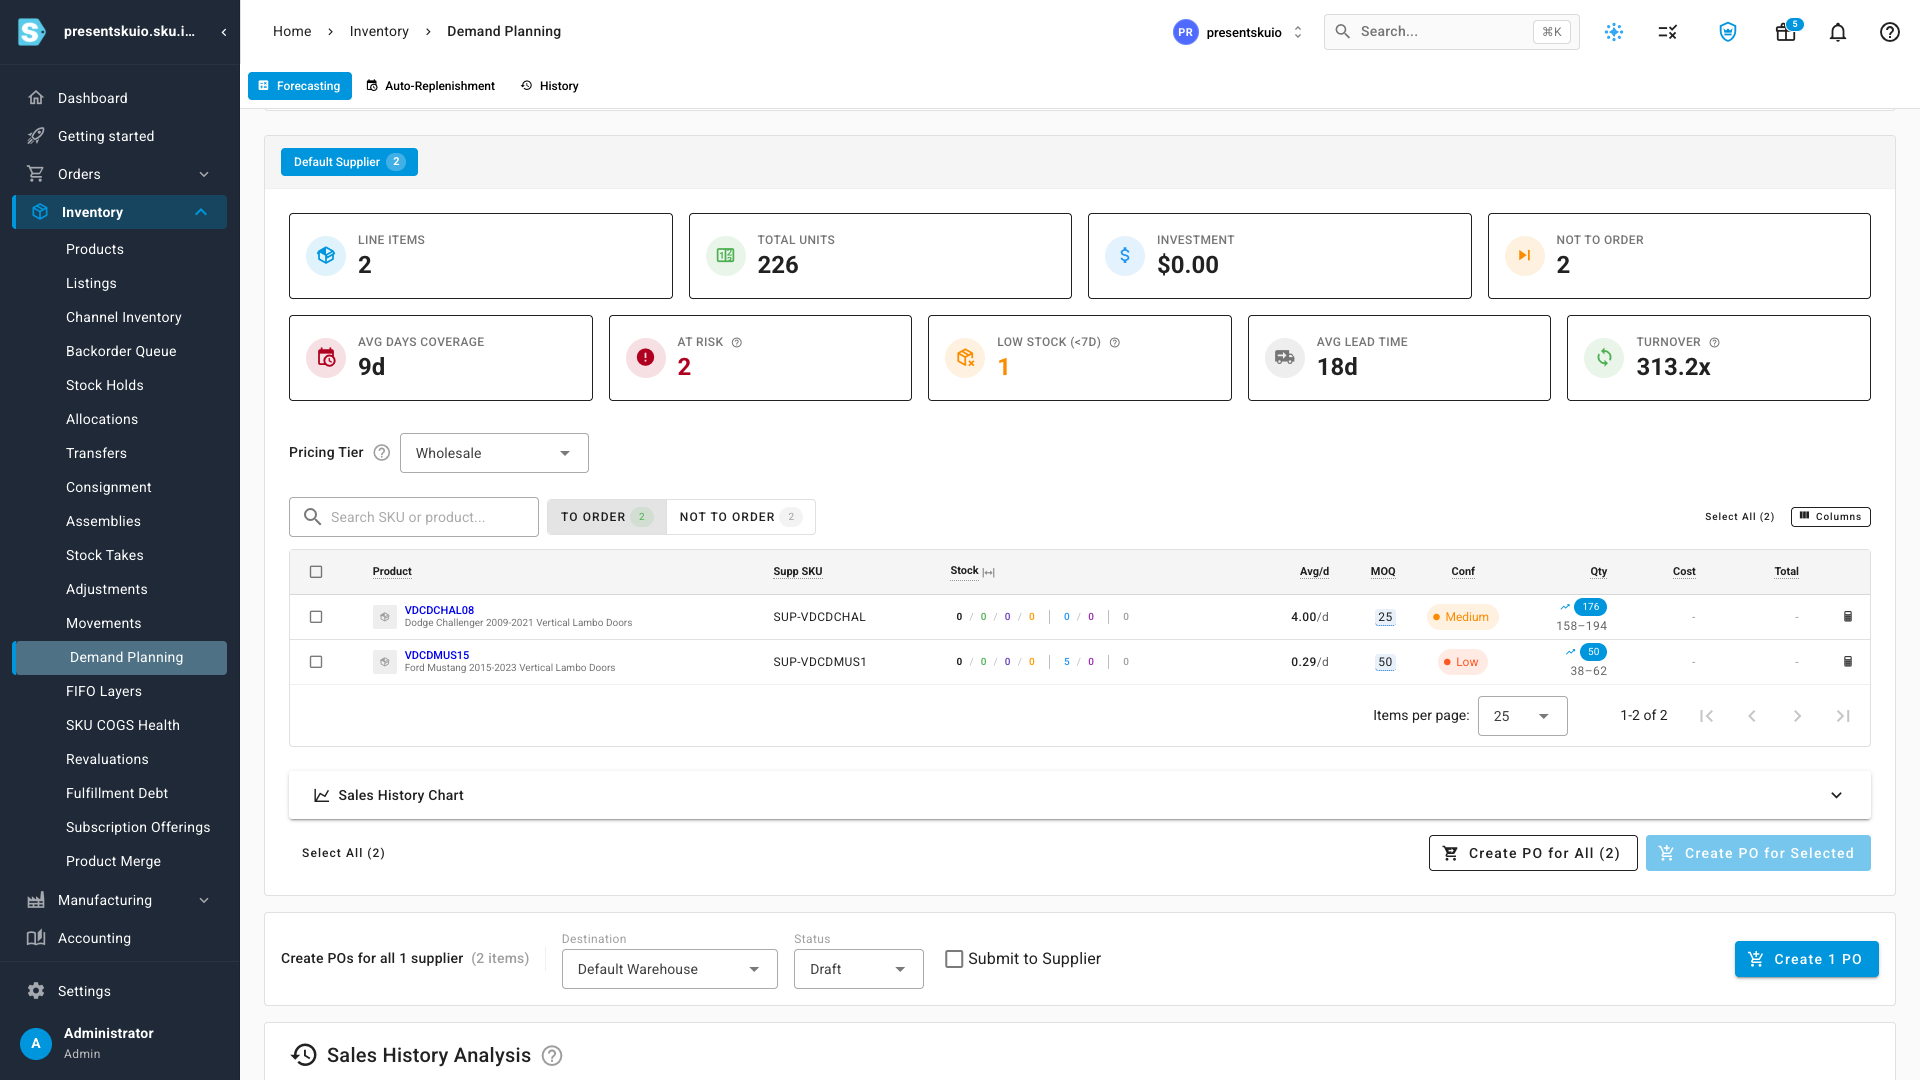
- Every forecast line shows a confidence tier — High, Medium, Low, or New — so you can see at a glance which recommendations to trust and which to review.
- A likely range sits under each quantity (for example, 158–194), so you see the uncertainty, not just a single point number.
- Brand-new and thin-history products are flagged New instead of quietly emitting a confident-looking figure you can't rely on.
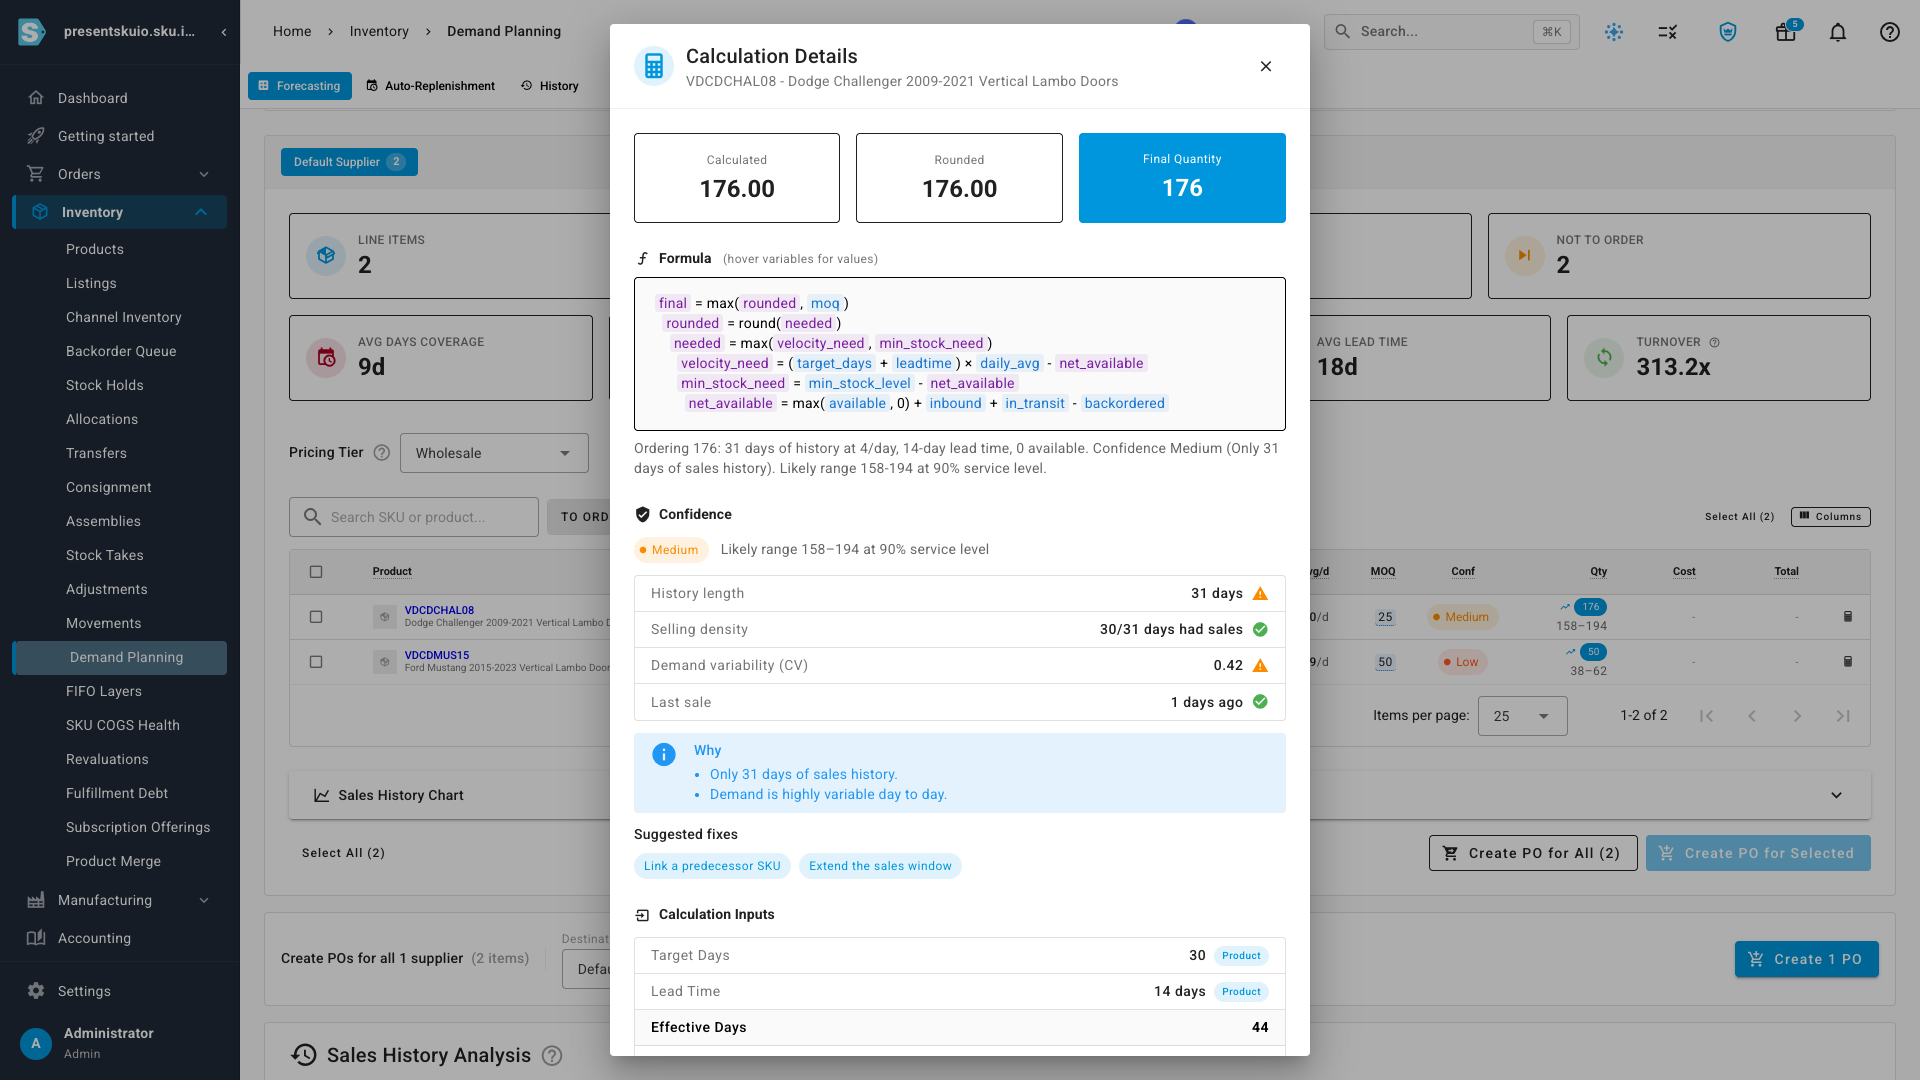
- The calculation detail explains the score — the drivers behind it, plain-English reasons, and a suggested fix when confidence is low.
- A one-line rationale puts the whole calculation in words anyone can read — no formula-decoding required.
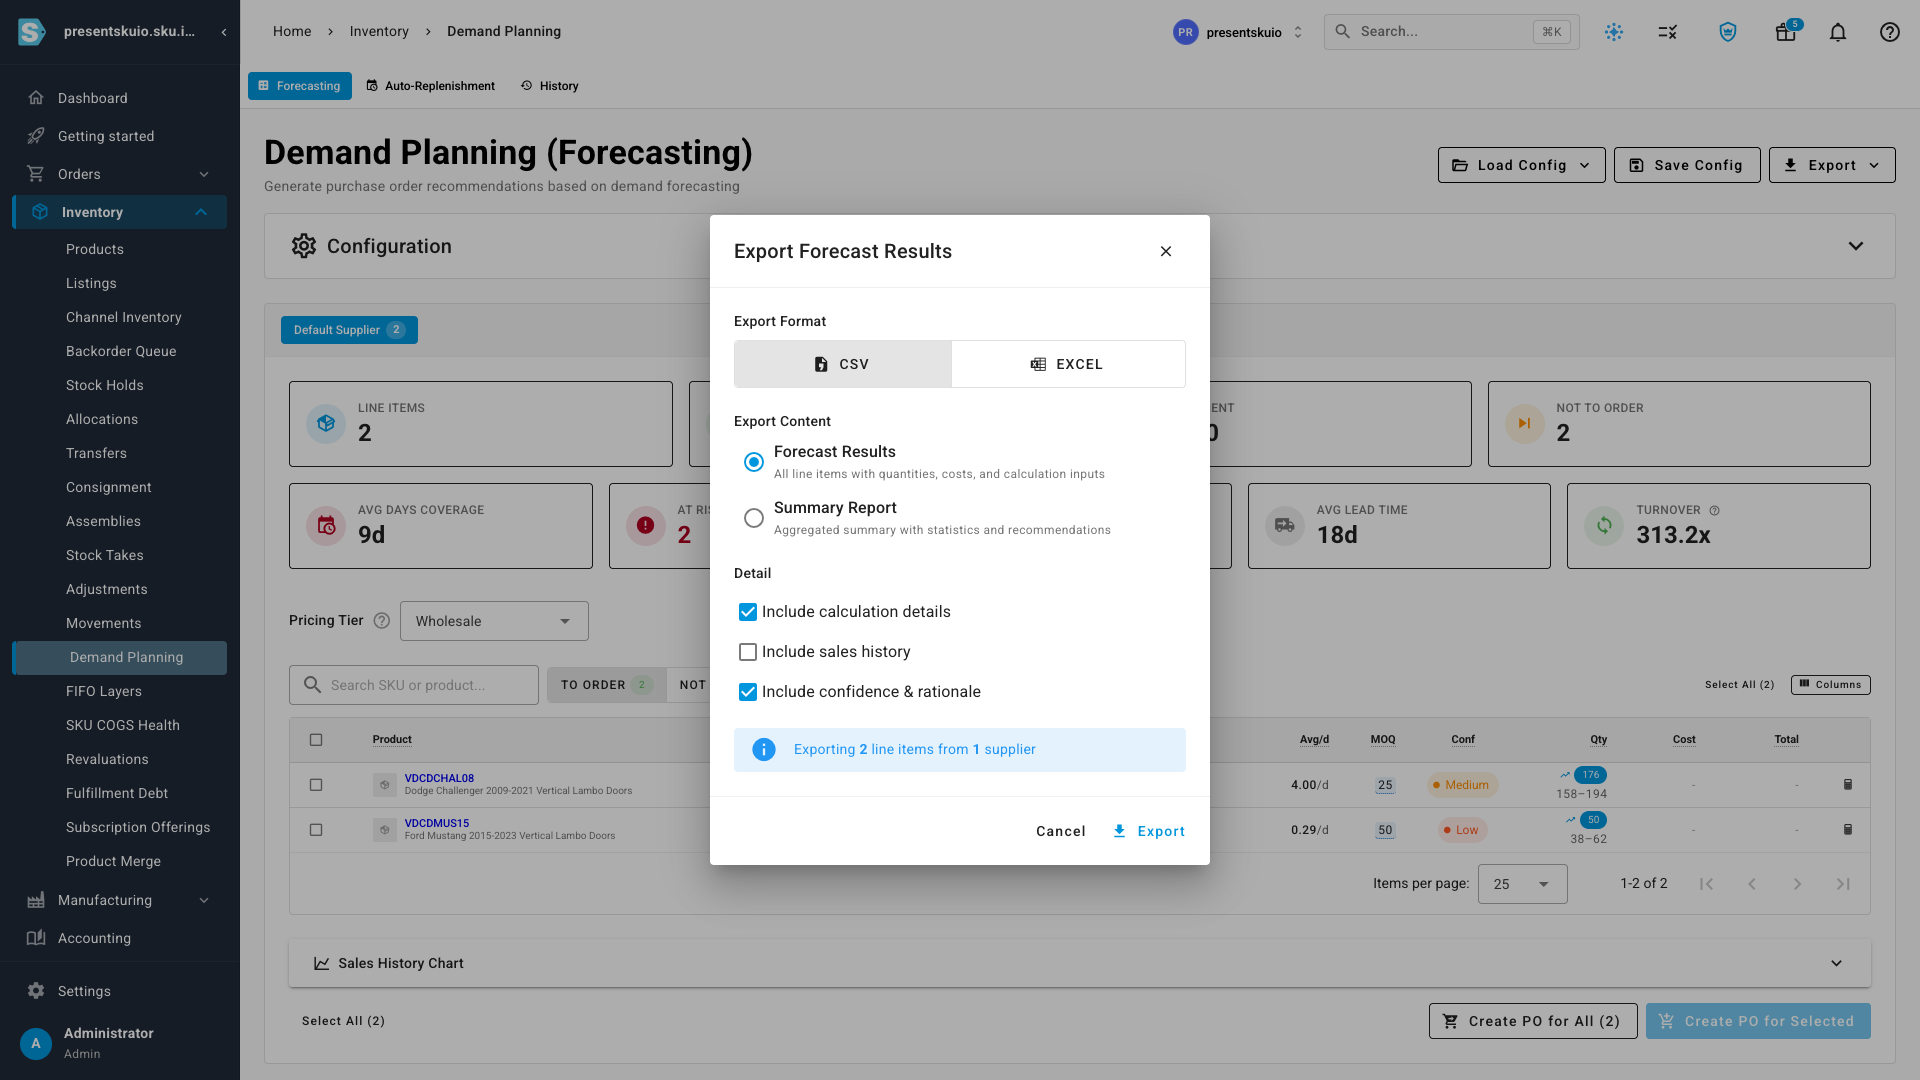
- The export now matches what you see on screen — confidence, the likely range, the input sources, and the rationale all download to CSV or Excel for a complete, defensible audit trail.
See which numbers to trust — at a glance
Build a forecast and each line now has a Conf column. A colored chip tells you the confidence tier for that recommendation, and just below the recommended quantity you'll see the likely range the forecast expects demand to fall within. A steady, well-established product reads Medium or High; an intermittent seller with sparse history reads Low; a product with almost no sales in the window reads New — so a thin-data guess never masquerades as a sure thing.
Understand the why — and what to do about it
Open any line's calculation detail and the new Confidence section shows exactly how the score was reached. Four drivers are laid out plainly — how much sales history the product has, how densely it actually sold, how variable demand is day to day, and how recently it last sold — each marked good or flagged. Below that, a short Why explains the tier in one or two sentences, and Suggested fixes point you at the next step (for example, link a predecessor product or extend the sales window). The likely range is stated as a service level, and a plain-language rationale summarizes the whole thing: "Ordering 176: 31 days of history at 4/day, 14-day lead time… Confidence Medium… Likely range 158–194 at 90% service level."
Export the whole story
When you export the forecast, a new Detail section lets you choose exactly how much of the calculation to include. Keep calculation details and confidence & rationale switched on and the download carries everything you see in the app — the confidence tier and score, the likely range, the input sources, and the plain-language rationale for every line. The file you hand to finance is now a complete, self-explanatory record of how each reorder number was reached.
Where to find it
- See it on your forecast: open Inventory → Demand Planning, choose your suppliers, and click Build Forecast — the Conf column and the likely-range figures appear on every line.
- Dig into a number: click the calculator icon on any row to open the calculation detail, then read the Confidence section, the drivers, and the rationale.
- Take it with you: click Export (top right) and, under Detail, keep Include confidence & rationale switched on before downloading your CSV or Excel file.