Profitability Report — group by any product attribute
Which material actually makes you money? Which collection is quietly dragging your margin down? If you track those things as product attributes, the answer has always been in SKU — but the Profitability Report couldn't see it. It grouped by Brand, SKU, Supplier, Sales Channel, Product Type, and Sub Sales Channel, and that was it. Anything else meant exporting to a spreadsheet and pivoting by hand. Group by Attribute fixes that. The Profitability Report now offers a seventh grouping: pick any custom product attribute you've defined — Material, Collection, Season, Fit, anything — and the report builds one row per value, with the same revenue, cost, profit, and margin math as every other dimension.
✨ What this means for you:
- Your taxonomy becomes a profit lens. Any attribute you maintain on products is instantly a report dimension — no setup, no engineering, no export-and-pivot.
- Nothing slips through. Products without a value for the chosen attribute roll into a clear None bucket, so your totals always reconcile to total sales — and the None row shows you exactly where your tagging has gaps.
- Checkbox attributes read like English. Yes/No attributes show as Yes and No rows, not 1s and 0s.
- Drill all the way down. Click any value to see the orders behind it, sort and search them, and export the list to CSV — the export matches what's on screen, filters and all.
- Works with everything you already use — date ranges, sales-channel filters, monthly/weekly trends, the cost breakdown, and top/bottom-N limits for high-variety attributes.
Pick an attribute, get a report
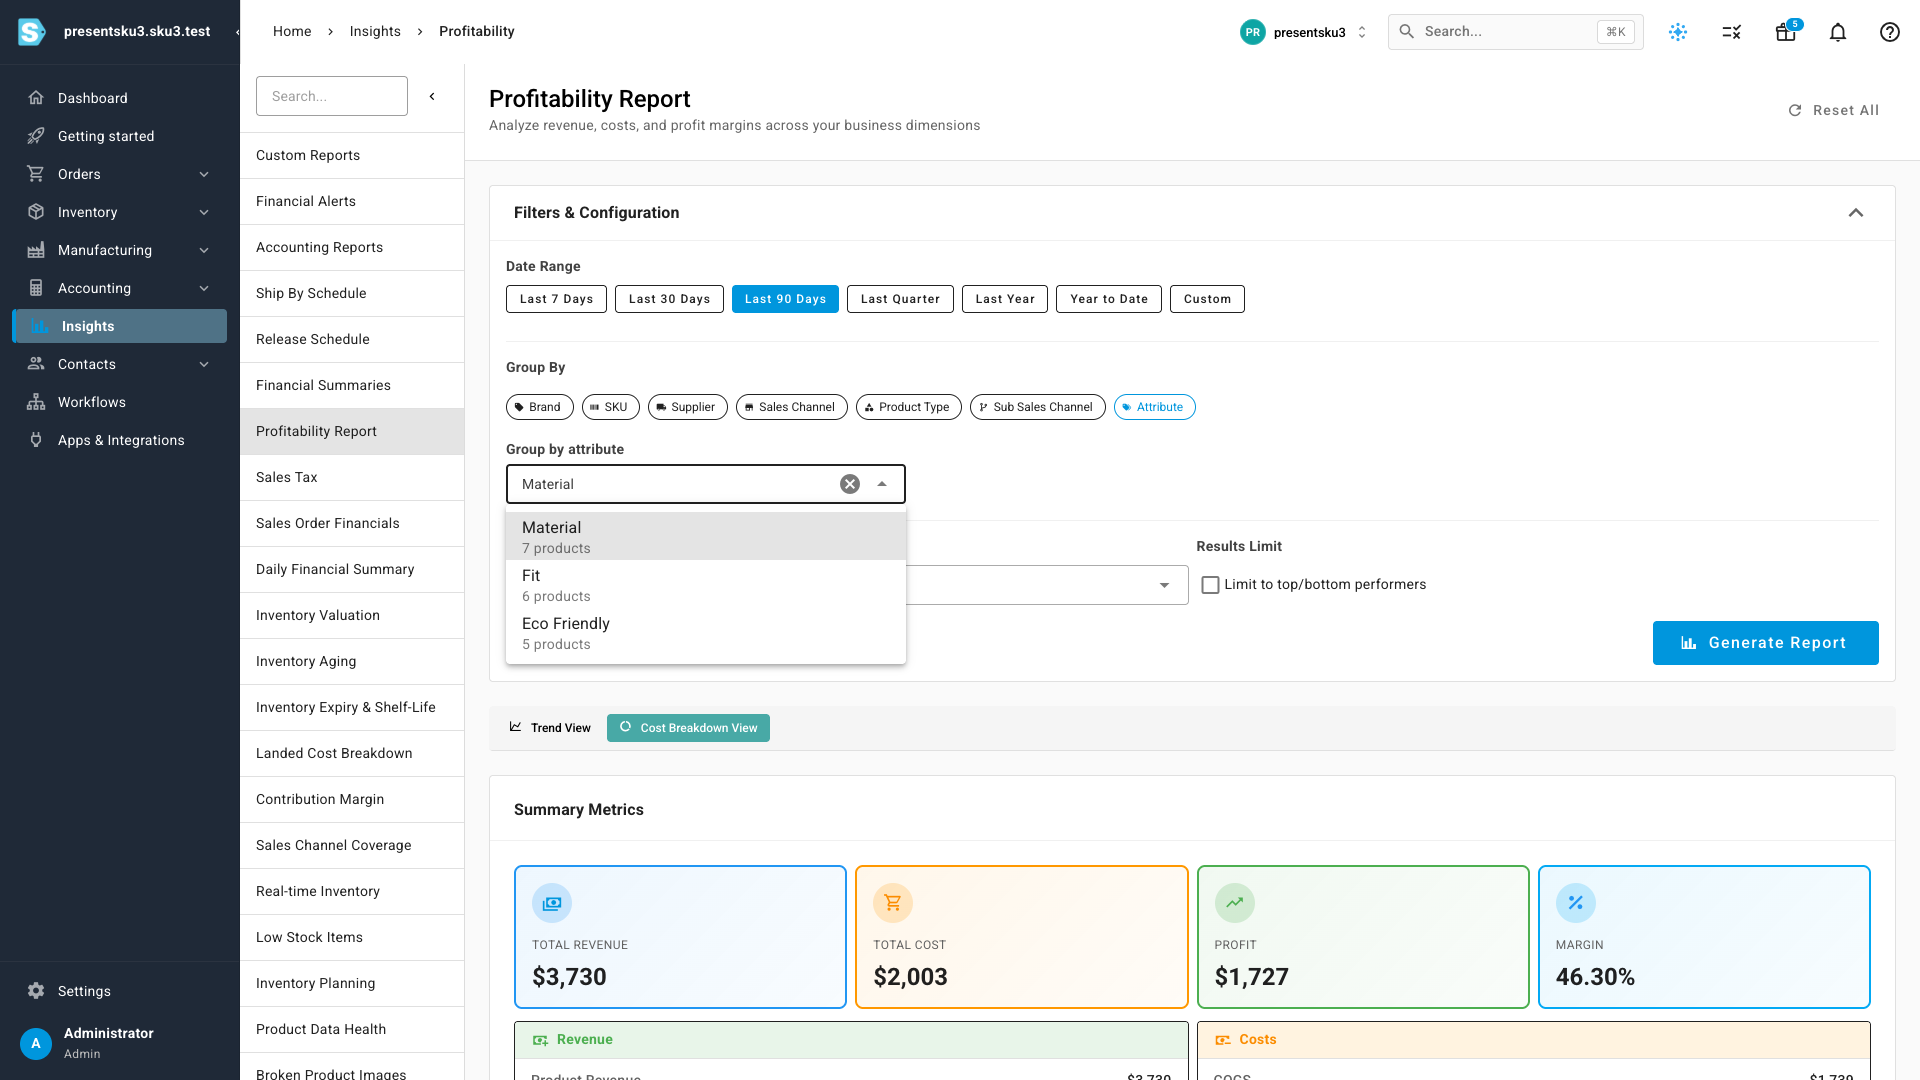
Select the new Attribute chip in Group By and a searchable picker appears. Each attribute shows how many products carry a value for it — sorted so your best-covered attributes are on top — which makes it easy to pick one that will produce a meaningful report.
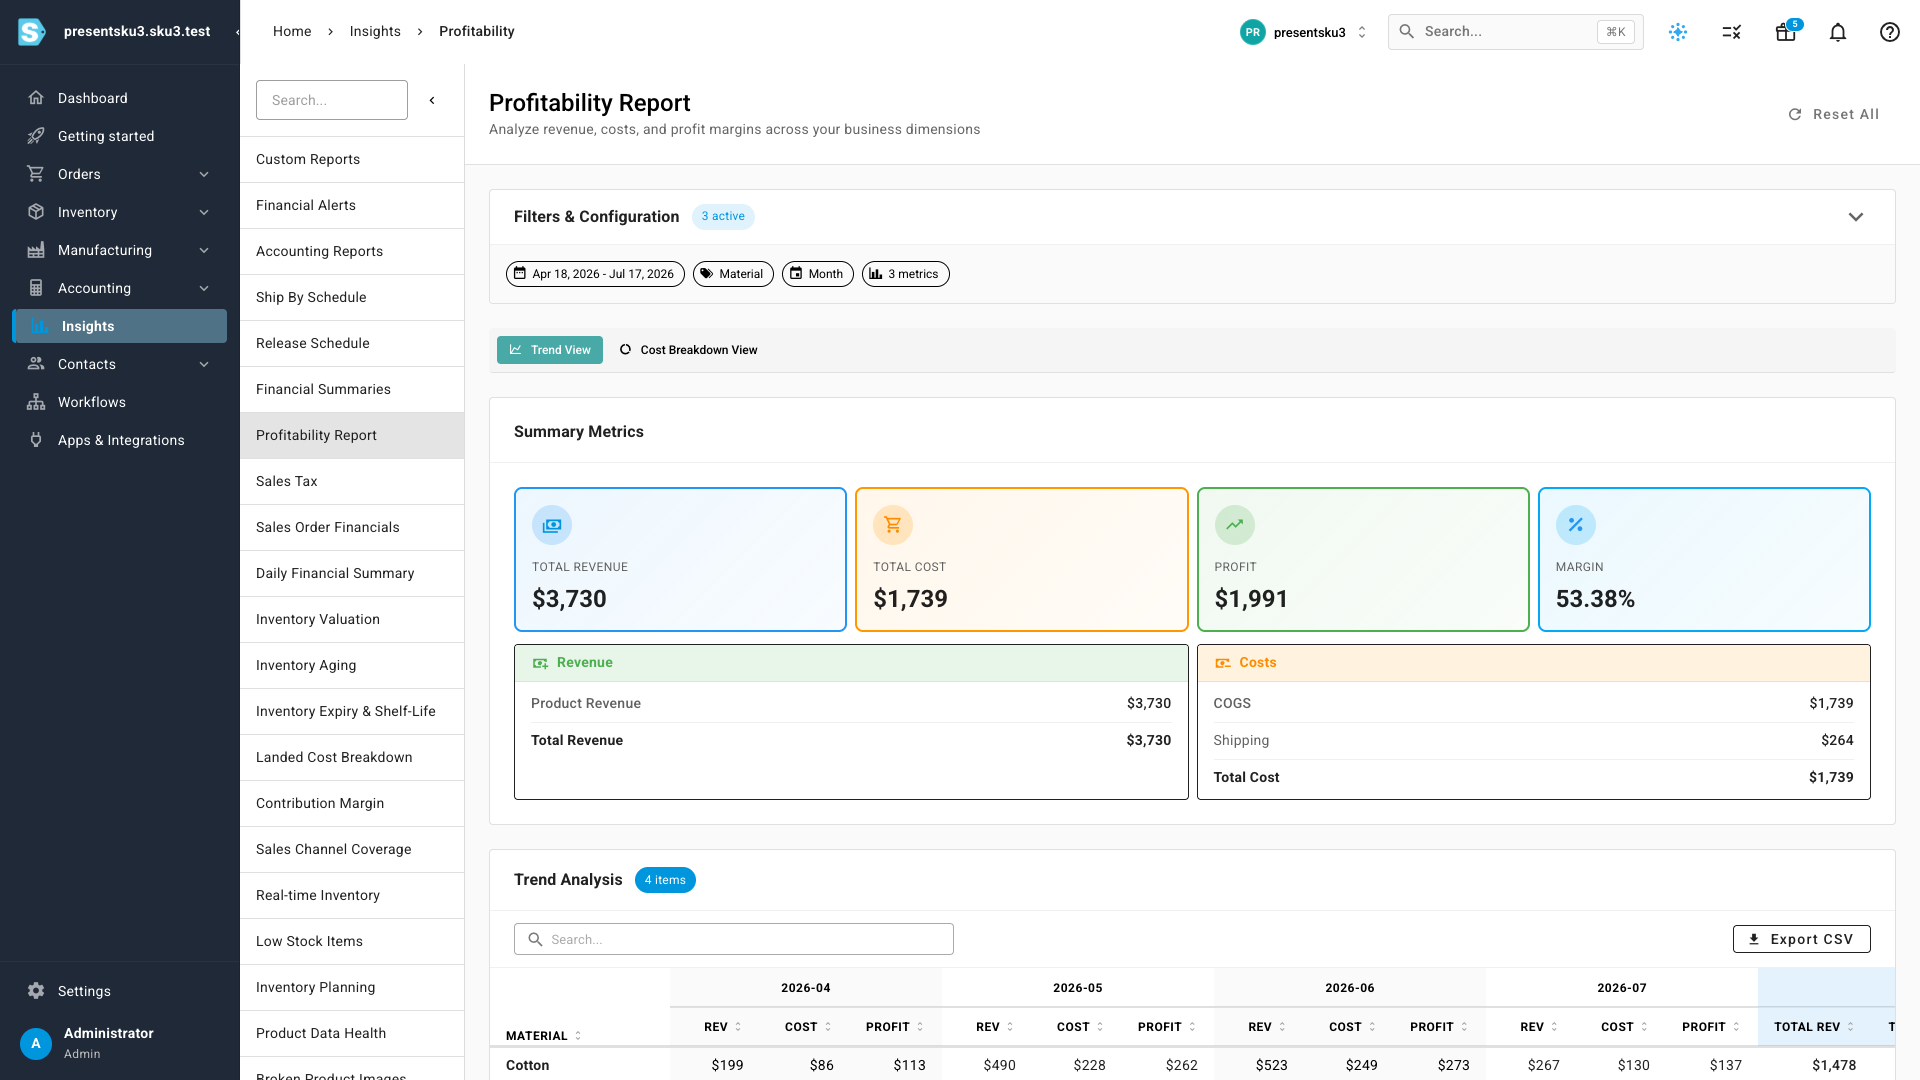
Generate the report and the trend view builds one row per attribute value, month by month, with the column header named after your attribute. Summary metrics, charts, and CSV export all follow along.
Drill into any value
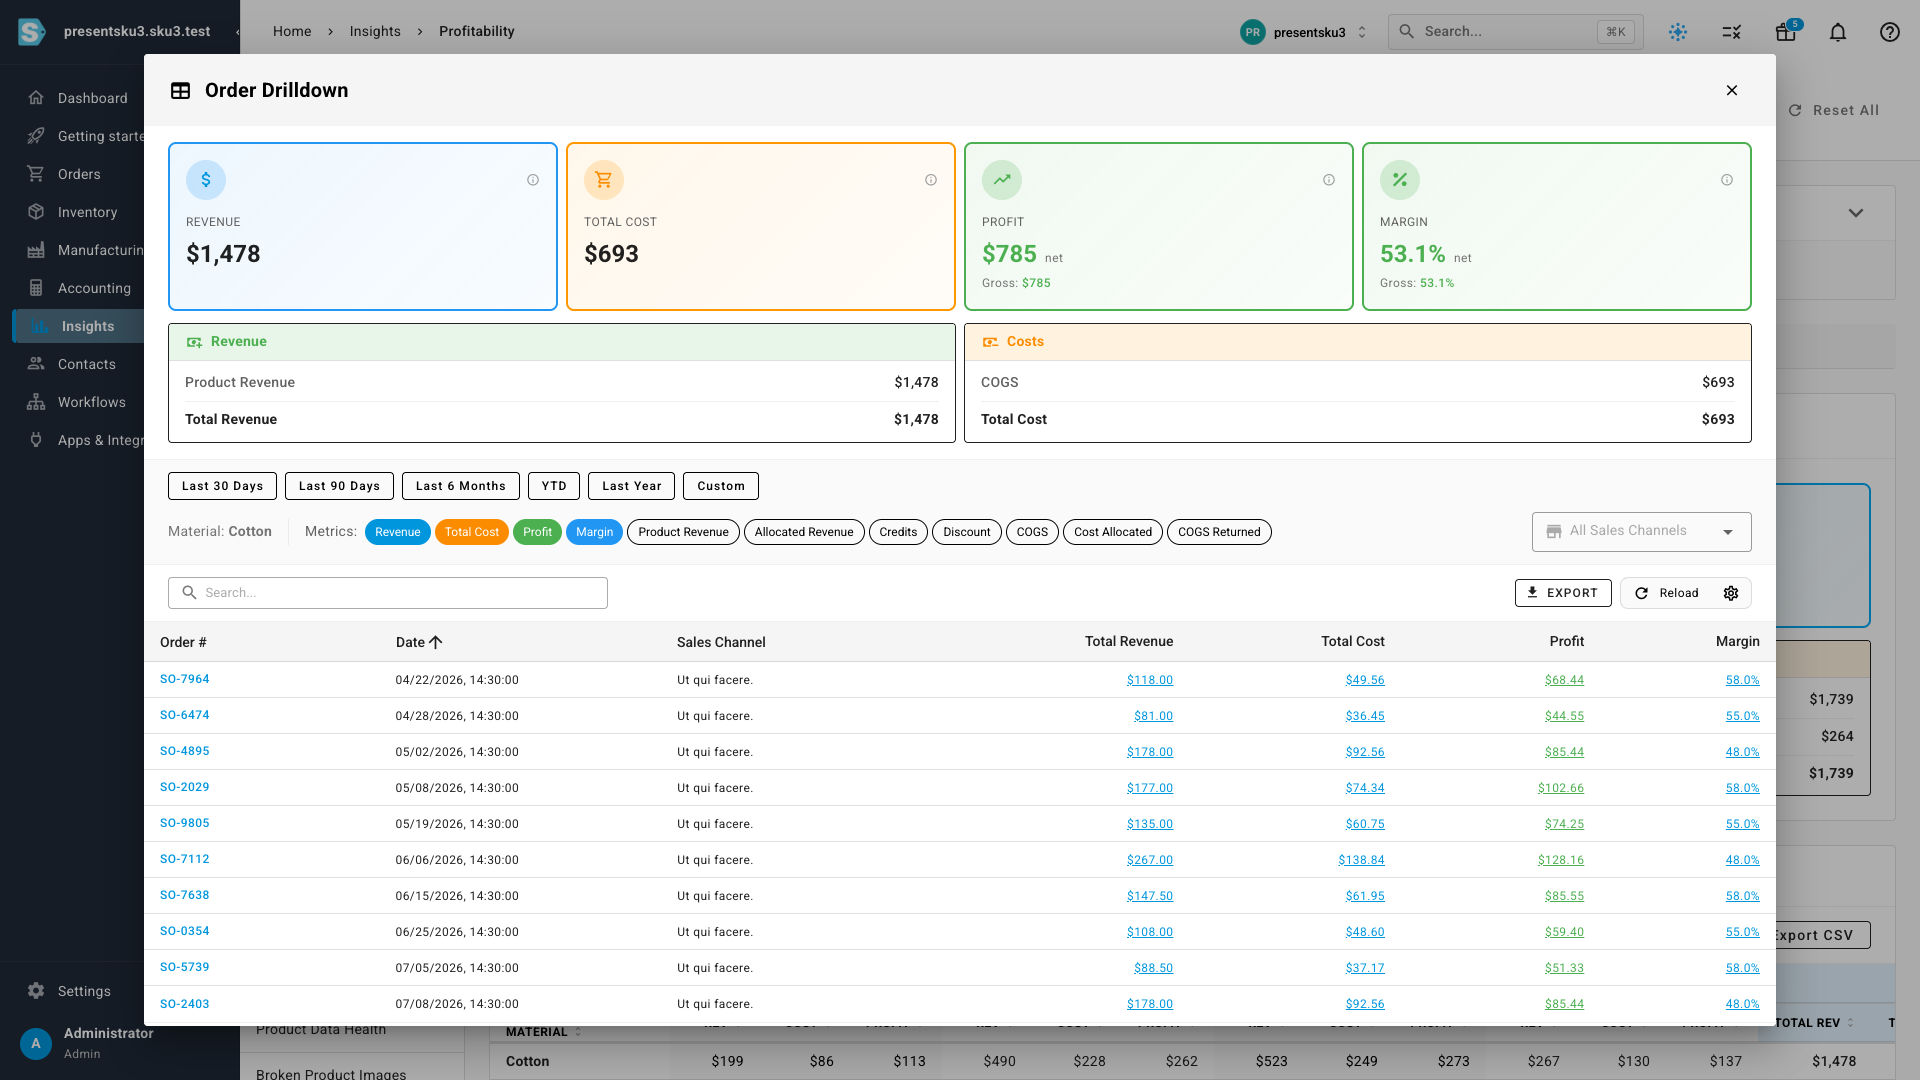
Every row is clickable. Drilling into Cotton opens the order-level view scoped to just that value — labeled with your attribute so you always know what you're looking at — with the same revenue and cost cards, metric toggles, sorting, search, and CSV export you already know from the other dimensions. The totals match the row you clicked, to the dollar.
Cost breakdown, by your attribute
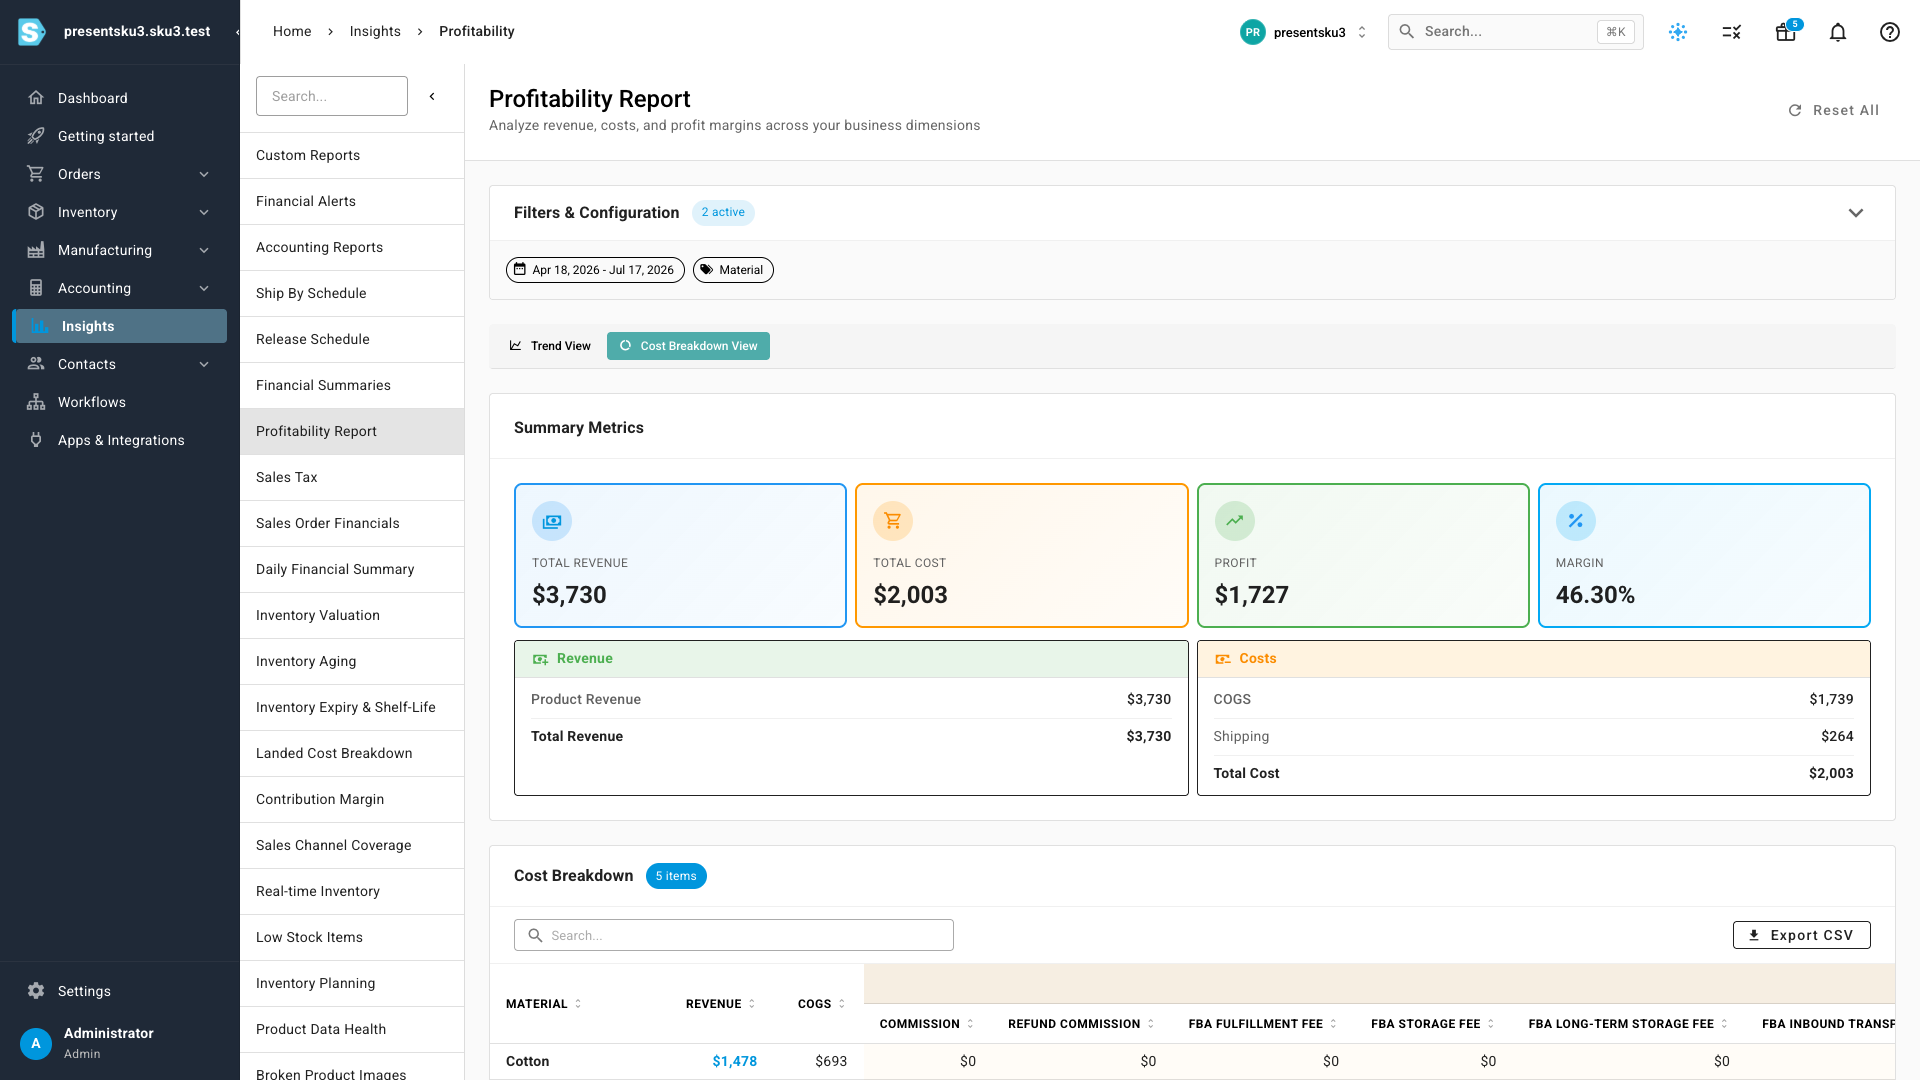
The Cost Breakdown view works too: each attribute value gets its full financial-line-type breakdown — marketplace fees, shipping, commissions, and the rest — and charges that aren't allocated to products surface in a dedicated Non-Product / Unallocated row, so the report still reconciles to your total sales.
Where to find it
Insights → Profitability Report, then choose Attribute in the Group By row and pick any of your product attributes. Product attributes themselves are managed under Settings → Products → Attributes.