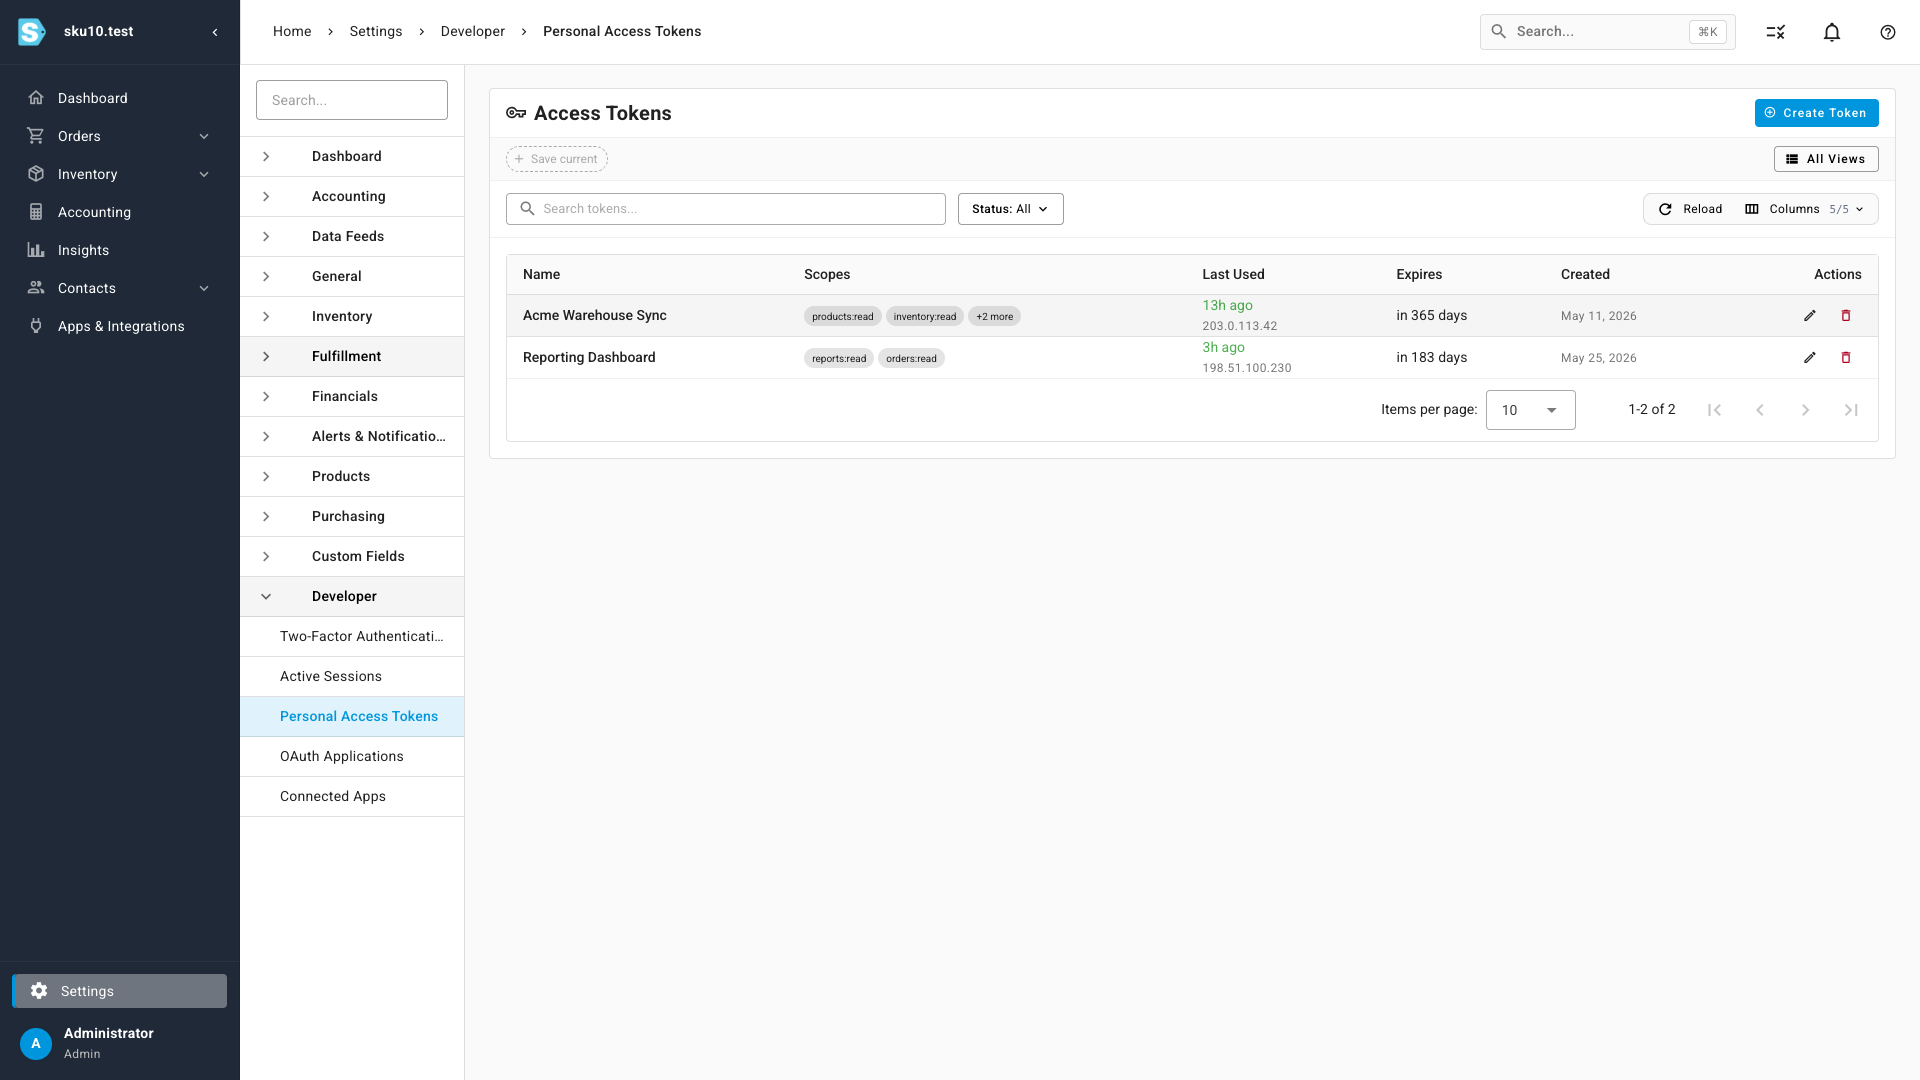
API Usage Log — see exactly what every access token is doing
If you've connected a script, a custom integration, or an automation tool to SKU with a personal access token, that token has been a black box: is it still being used? Is it failing? Is it slow? And — the question that really matters — is it being used from somewhere it shouldn't be? API Usage Log answers all of that. Every API request made with a personal access token is now recorded automatically, and each token gets its own analytics dashboard and a searchable, filterable log of every single request.
✨ What this means for you:
- A usage dashboard for every token — total requests, success rate, average and p95 response time, and the unique IP addresses using it, over the last 7, 30, or 90 days.
- A requests-over-time chart that makes a healthy integration — or one that suddenly went quiet or started erroring — obvious at a glance.
- A status breakdown and top-endpoints table showing where the traffic goes and how each endpoint performs.
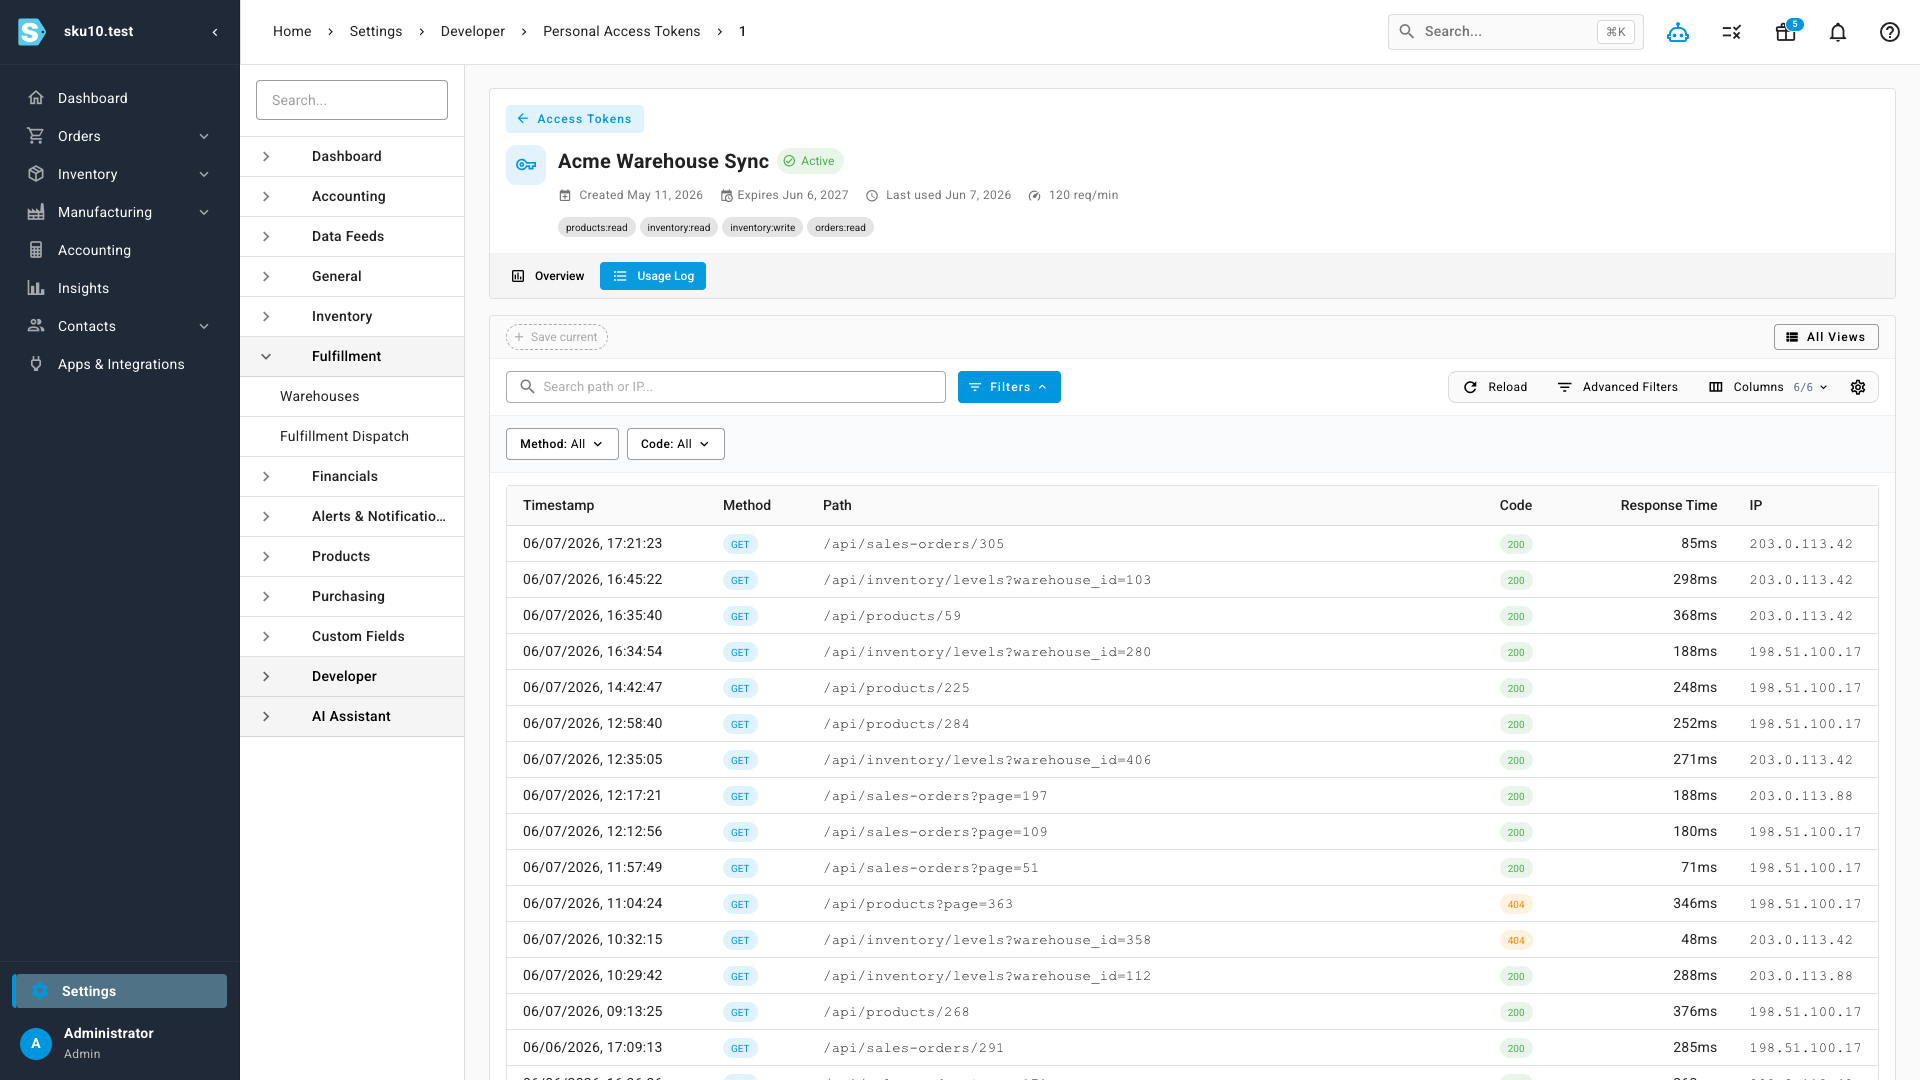
- A complete request log — timestamp, method, path, status code, response time, and source IP for every call — searchable by path or IP and filterable by method and status code.
- Security visibility: if a token ever leaks, the IPs and request patterns are right there. No more guessing.
A dashboard for every token
Open any token and the Overview tab gives you its vital signs: total requests, success rate, average response time (with p95), and how many distinct IP addresses have used it — for the period you pick. Below the cards, Requests Over Time charts the token's daily traffic, with errors plotted as their own line — so a failing integration shows up as a rising red line instead of a support ticket.
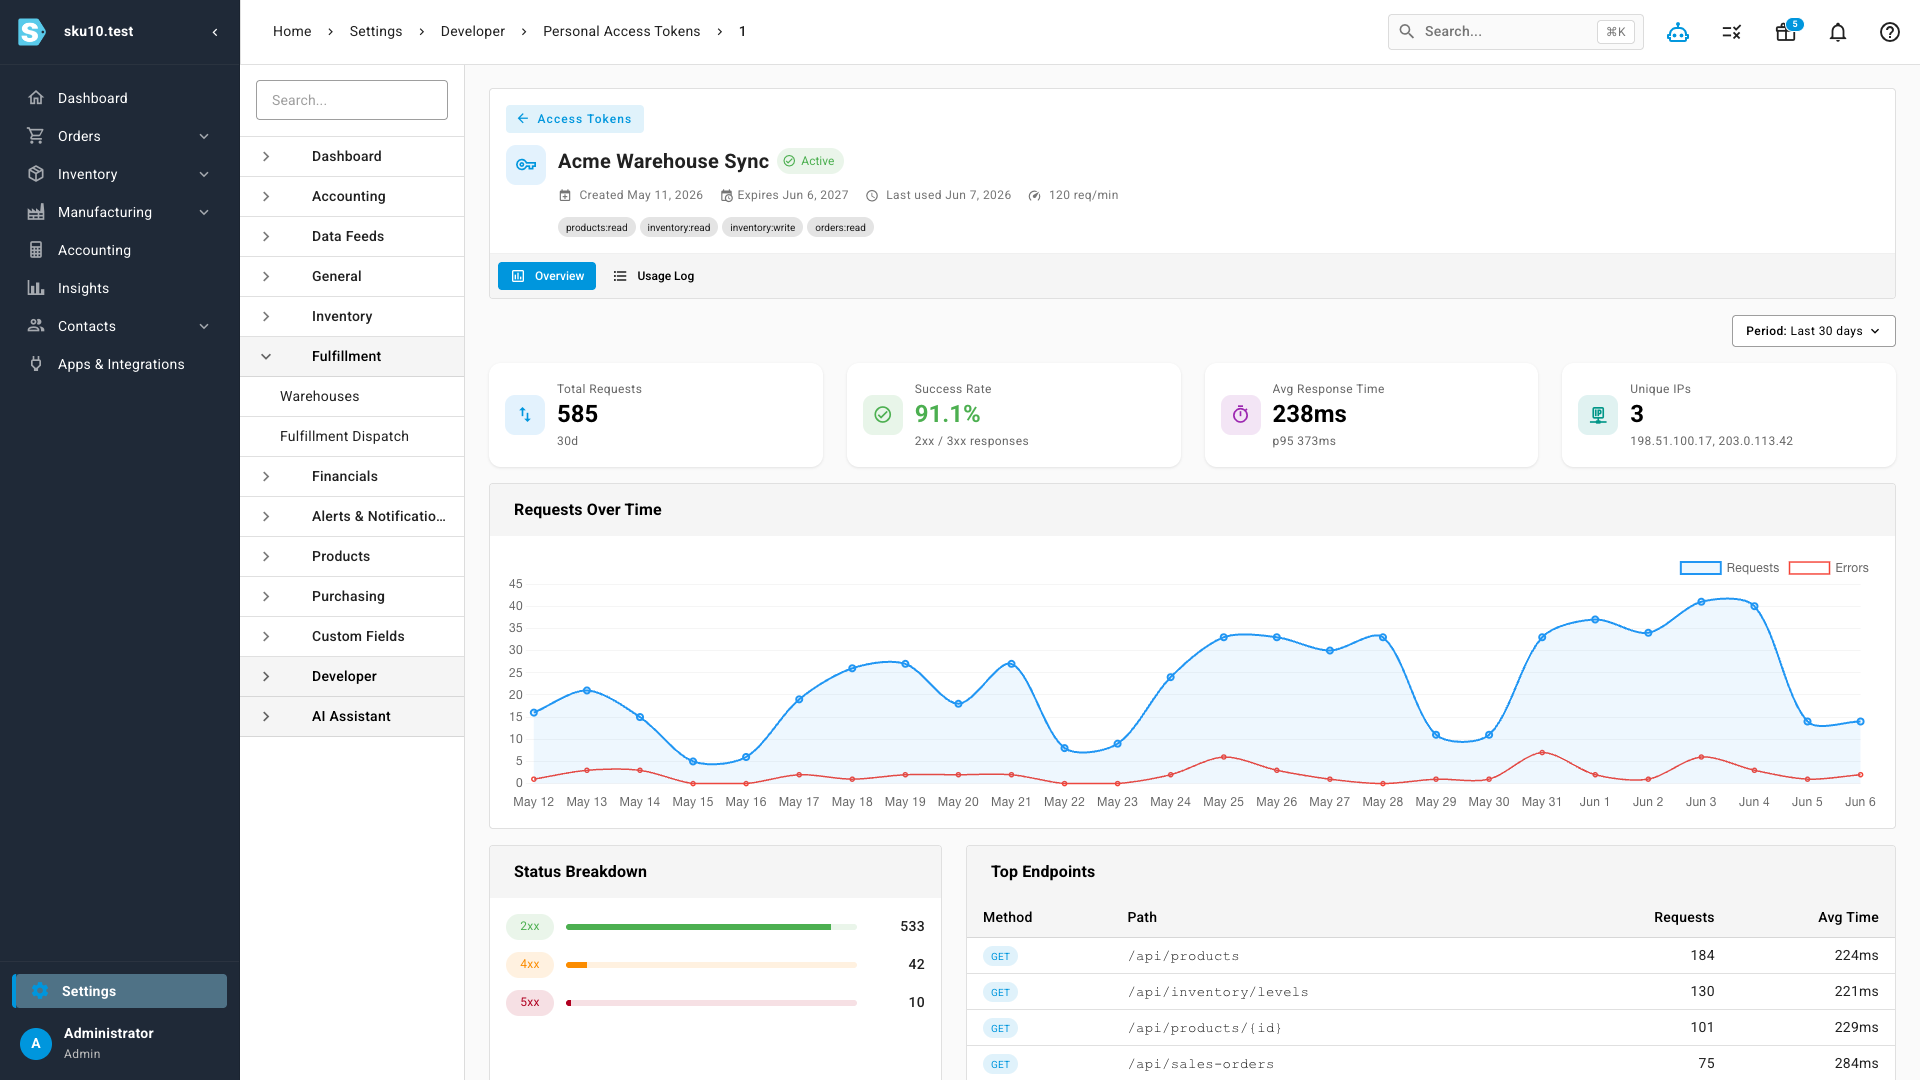
The Status Breakdown panel tallies responses by class (2xx, 4xx, 5xx), and Top Endpoints ranks the paths the token hits most, with request counts and average response times — so you can see at a glance what an integration actually does, not just that it's alive.
Every request, on the record
The Usage Log tab is the full ledger: every request the token has made, with timestamp, method, path, status code, response time, and the IP it came from. Search by path or IP, filter by method or status code, and save the views you come back to — it works like every other data table in SKU.
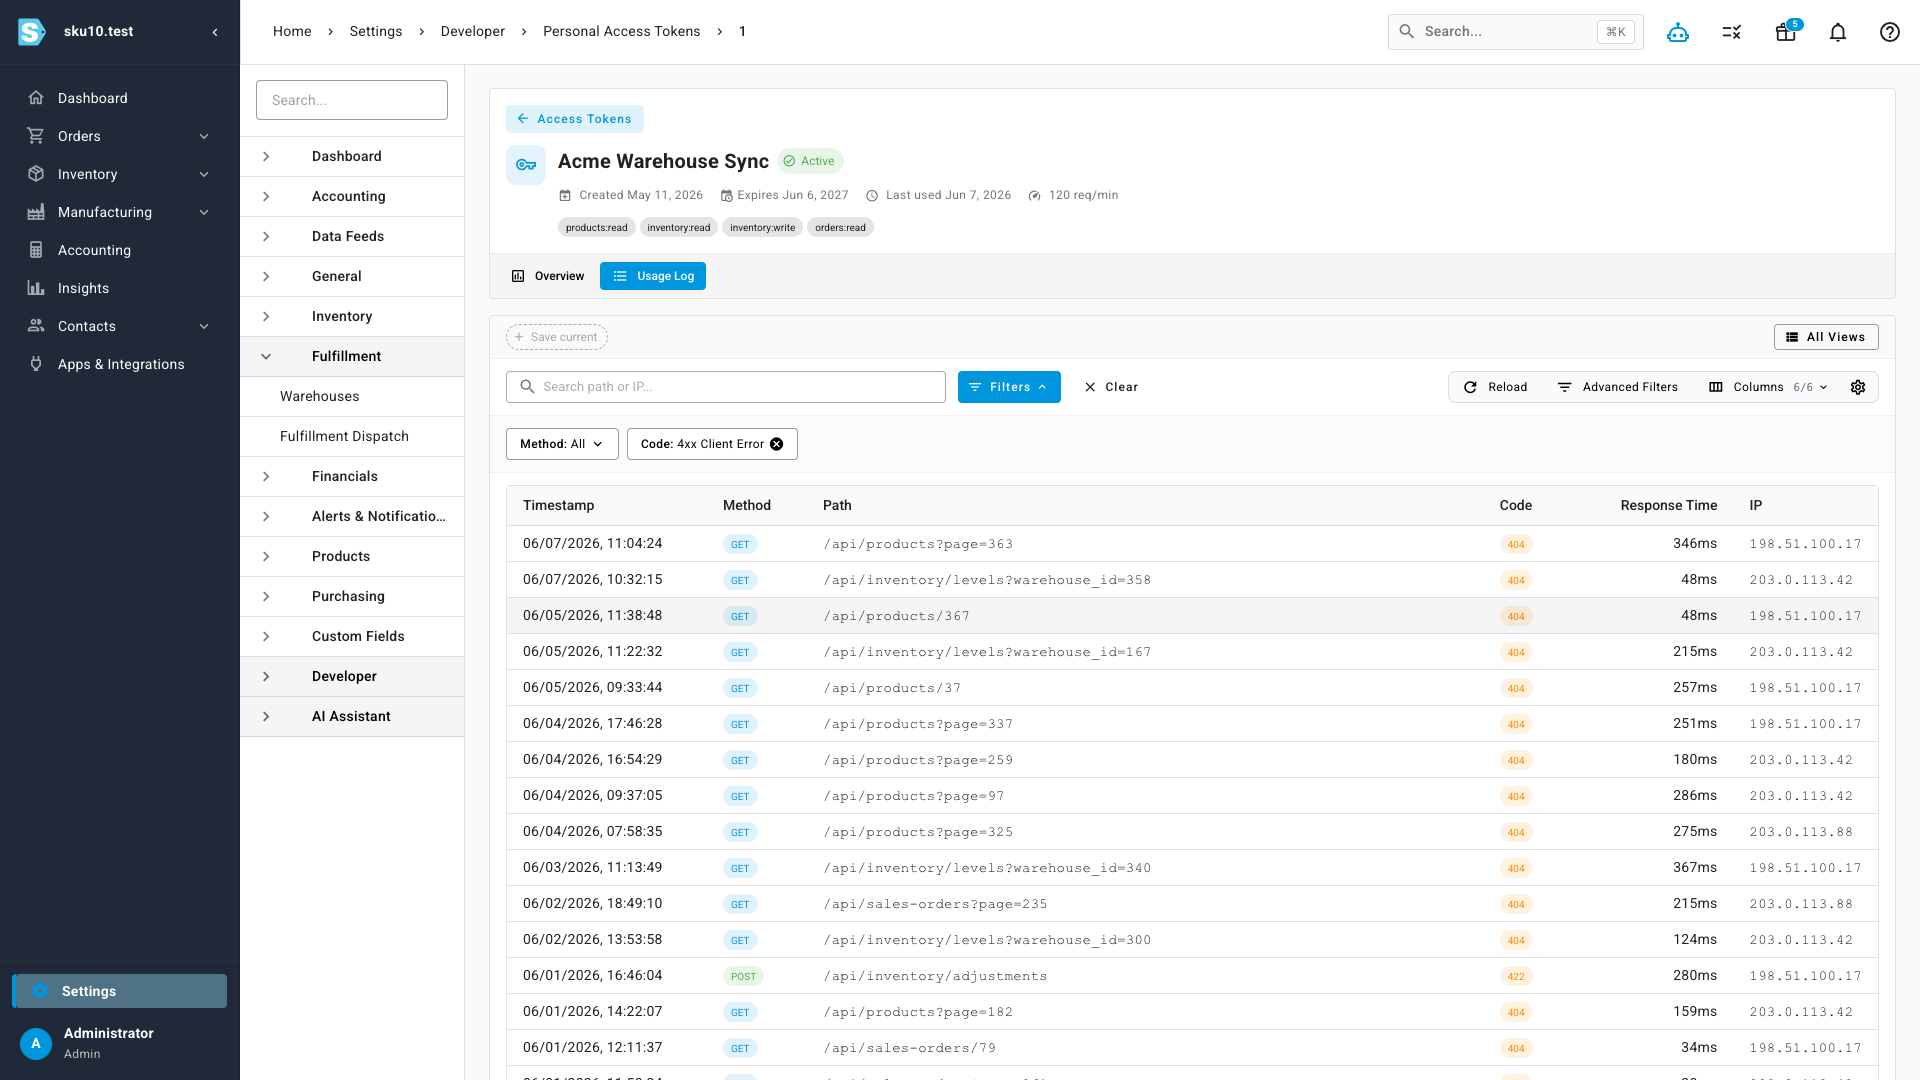
Find failures fast
When an integration misbehaves, you no longer have to reproduce it — the evidence is already captured. Filter the log to client or server errors and you're looking at exactly which calls failed, when, and how they failed.
Where to find it
Go to Settings → Developer → Personal Access Tokens. The token list now shows when — and from which IP — each token was last used; click any token to open its Overview dashboard and Usage Log.