Purchase order cash-flow schedule
The cash-flow schedule is a forward-looking planning view that projects when the money for your open purchase orders — and the deposits tied to them — will come due. Instead of reading your exposure one PO at a time, it places every open obligation on a single dated timeline, so you can see cash spikes coming, spot overdue payments, and clean up POs that still lack good dates.
- Exposure — money you have committed to pay a supplier but haven't paid yet: the open value of a purchase order, or the value of a deposit (an up-front payment a supplier asks for before they'll start or ship an order). It's cash you owe, not cash you've spent.
- Deposit schedule — the rule that says when each slice of a PO comes due — for example, "30% on approval, 70% on shipment." A PO can carry an explicit schedule, or SKU.io can infer one from the supplier's default terms.
The schedule reads from your existing POs. It never changes them.
Before you begin
- The schedule is a read-only planning report built from your open purchase orders. It projects outflows only — money you owe suppliers — so you read it against your own expected inflows (money coming in) and cash on hand.
- Anyone who can open the Purchase Orders list can open the schedule.
- The more complete your PO data is — payment terms, deposit due dates, and shipment or PO ETAs (Estimated Time of Arrival) — the more of your exposure lands on a confident, dated timeline rather than falling back to an estimate.
Open the schedule
- Go to Orders → Purchase Orders.
- Click Cash Flow Schedule in the list toolbar.
- Use Back to Purchase Orders at the top of the schedule to return to the list.
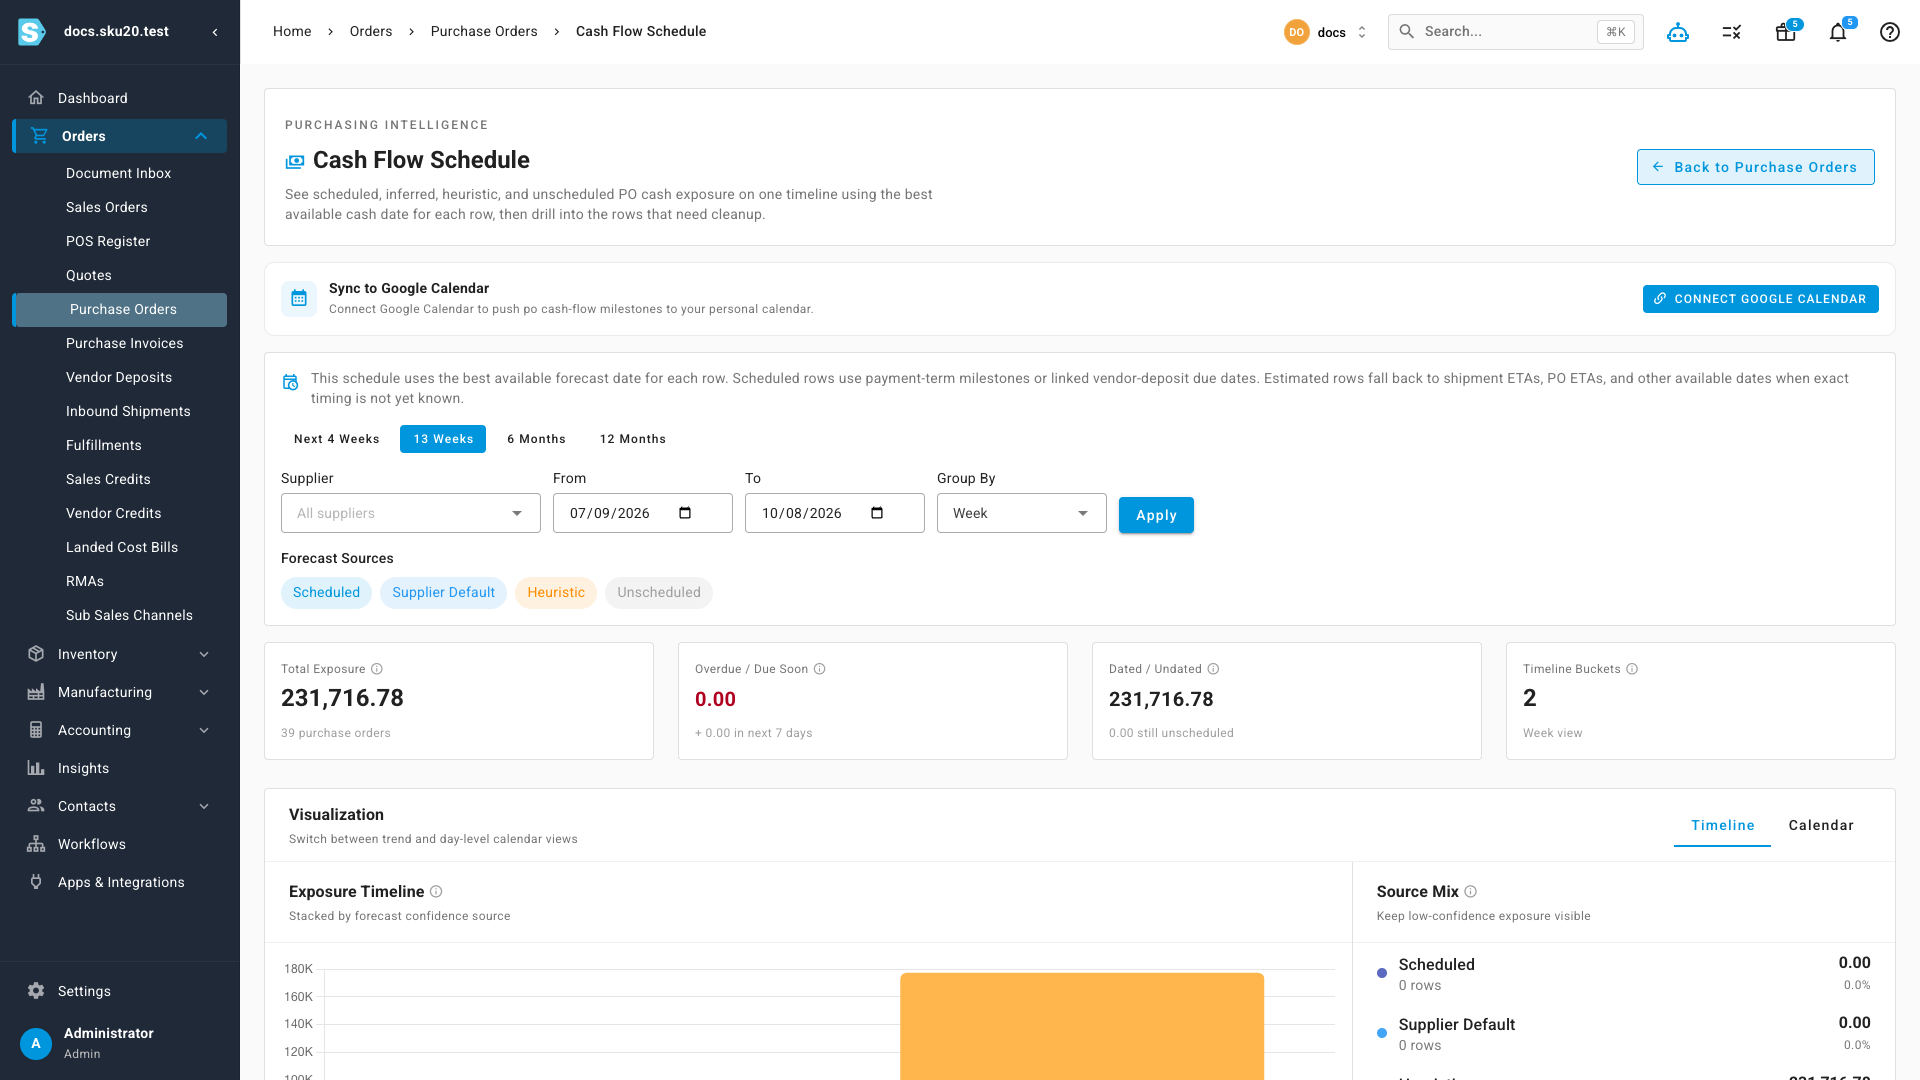
What you'll see: the schedule opens on a default window of the next 13 weeks, grouped by week, with every forecast source included.
What the schedule projects
Every open obligation is placed on the timeline using the best available payment date for that row, and each row is tagged with the forecast source — the kind of information that supplied the date. The source tells you how much to trust the timing:
| Forecast source | Where the date comes from | Confidence |
|---|---|---|
| Scheduled | The PO sets an explicit payment schedule, or the row is a linked vendor deposit with its own due date. The PO itself defines the milestone. | Highest |
| Supplier Default | The PO has no explicit schedule, so the date is inferred from the supplier's default payment term or default deposit behavior. | Medium |
| Heuristic | No usable schedule exists, so the date is estimated from ETA-style dates (shipment ETA, PO ETA) and fallback planning rules. | Lower |
| Unscheduled | Exposure that still can't be placed on a dated timeline because the PO lacks enough timing data. It's counted in your totals but kept off the dated chart and calendar. | Undated |
Keeping Heuristic and Unscheduled visible is deliberate. A large slice of either is a signal that some of your projected cash timing is only a guess — and that the underlying POs need real payment terms or deposit due dates before you can plan around them.
Filter and group the schedule
The filter bar controls what the schedule projects and how it's bucketed:
| Control | What it does |
|---|---|
| Date presets | One-click windows: Next 4 Weeks (grouped by day), 13 Weeks (by week), 6 Months and 12 Months (by month). |
| Supplier | Narrow to a single supplier, or leave it on All suppliers. |
| From / To | Set a custom date window. |
| Group By | Bucket the timeline by Day, Week, or Month. |
| Forecast Sources | Toggle Scheduled, Supplier Default, Heuristic, and Unscheduled on or off to control how much projected exposure is included. At least one source stays selected. |
Click Apply after changing the supplier or date window to refresh the report.
Read the summary tiles
Four tiles at the top summarize whatever the current filters return:
| Tile | What it shows |
|---|---|
| Total Exposure | All open PO cash exposure the filters return — dated and undated — with the number of purchase orders behind it. |
| Overdue / Due Soon | Exposure with a due date before today (shown in red), plus a callout for dated exposure due within the next 7 days. |
| Dated / Undated | How much exposure has a forecast cash date versus how much is still unscheduled and therefore not placed on the timeline. |
| Timeline Buckets | The number of day, week, or month periods currently shown in the dated timeline. |
Timeline vs Calendar views
The visualization panel offers two ways to read the same dated exposure. Undated rows stay out of both views so the time axis stays honest.
| View | What it shows | Best for |
|---|---|---|
| Timeline | A stacked bar chart of dated exposure per period, with each bar split by forecast source so low-confidence timing stays visible. A Source Mix breakdown beside it shows how much of your total exposure comes from each source, as an amount and a percentage. | Spotting which weeks or months carry the biggest cash load. |
| Calendar | A daily calendar of dated exposure using the same best-available date as the timeline. Each day shows its total and the individual POs due. | Catching several payments that land on the same day — something a weekly or monthly bucket would hide. |
Below the visualization, a Time Buckets table lists numeric period totals — POs, Scheduled, Supplier Default, Heuristic, and Total for each period. When you group by week or month over a compact range, a Planning Grid also appears, laying the same period totals out as columns for faster period-to-period scanning.
A worked example: A split deposit across a $10,000 PO
Suppose you raise PO-DOCS-0500 with supplier Acme Supplies for $10,000, on a deposit schedule of 30% on approval, 70% on shipment:
| Slice | Amount | Due when | Forecast source |
|---|---|---|---|
| Deposit (30%) | $3,000 | On approval — say 1 Aug | Scheduled (the PO sets the milestone) |
| Balance (70%) | $7,000 | On shipment — ETA 20 Sep | Scheduled or Heuristic, depending on your data |
How the schedule reads it:
- Total Exposure for this PO is $10,000 across 1 purchase order — the two slices are two rows, one order.
- The $3,000 deposit lands on the 1 Aug bucket; the $7,000 balance lands on the 20 Sep bucket. On the Timeline you see two separate bars, not one $10,000 spike.
- If the shipment has a firm date on the PO, the $7,000 shows as Scheduled. If it only has a rough ETA, it shows as Heuristic — still on the chart, but flagged as an estimate.
- If the PO carried no dates at all, the $7,000 would fall into Unscheduled — counted in Total Exposure, but kept off the dated chart until you add a date.
A single $10,000 number tells you what you owe. The split — $3,000 in early August, $7,000 in late September — tells you when, which is what actually protects your cash position.
Dig into the rows
Beneath the charts, exposure is broken out into one card per forecast source — Scheduled, Supplier Default, Heuristic, and Unscheduled — each showing its row and PO counts and its total. Within a card, rows are grouped into:
- Forecast Dated — rows already placed on the cash timeline using the best available date.
- Needs Better Dates — rows still missing enough timing detail to land on a dated cash day. These are the rows to fix if you want more of your exposure to become confidently dated.
Each row shows the milestone, the date basis behind it (which date the projection used), the forecast cash date and its confidence, the payment term, and the exposure amount. The PO number links straight to the purchase order, and any linked vendor deposit is called out on the row — see Vendor deposits for how deposit due dates feed the schedule.
Read outflows against your inflows
The schedule models only the outflow side — supplier payments and deposits due — so use it alongside your own view of expected inflows and available cash:
- Scan the Timeline or Time Buckets totals for periods where projected outflows exceed what you expect to have on hand, then reschedule or renegotiate before the crunch.
- Use the Calendar to catch single days where several payments land together.
- Treat Overdue exposure as the first thing to clear, and the next-7-days callout as your short-term commitment.
- Trim the Heuristic and Unscheduled slices over time by adding payment terms and deposit due dates to the underlying POs, so more of your plan rests on confident dates rather than estimates.
Keep milestones on your calendar
The schedule can also sync upcoming PO cash-flow milestones to Google Calendar. Use the calendar-sync toggle at the top of the schedule to turn syncing on, so payment due dates show up alongside the rest of your team's schedule.
The toggle pushes projected payment milestones to Google Calendar so they're visible to your team. It's a one-way convenience view — editing an event in Google Calendar doesn't change the PO or its schedule.
Next steps
- Browse, filter, and manage the purchase orders list — where the schedule opens from.
- Create POs from a forecast — the forecast-driven POs the schedule projects.
- Vendor deposits — deposits and their due dates.
- Record a supplier invoice and reconcile — settle what the schedule projects.
- Purchase orders overview — the full lifecycle and the rest of this section.