Forecast with trend-aware baselines
Demand Planning turns your recent sales into a suggested reorder quantity. By default it uses a flat average of the period you choose — which works for steady sellers, but under-buys a product that's growing fast and over-buys one that's winding down. With trend-aware baselines you can tell the forecast to follow each product's trend instead of a flat average, see exactly how every number was built, and turn a past promotion into a reusable lift that scales with your business.
Before you begin
- You need at least one supplier with products, and enough sales history for the products you want to forecast (a trend needs roughly eight weeks of data — with less, the forecast falls back to a flat average automatically).
- Open Inventory → Demand Planning.
Choose a baseline method
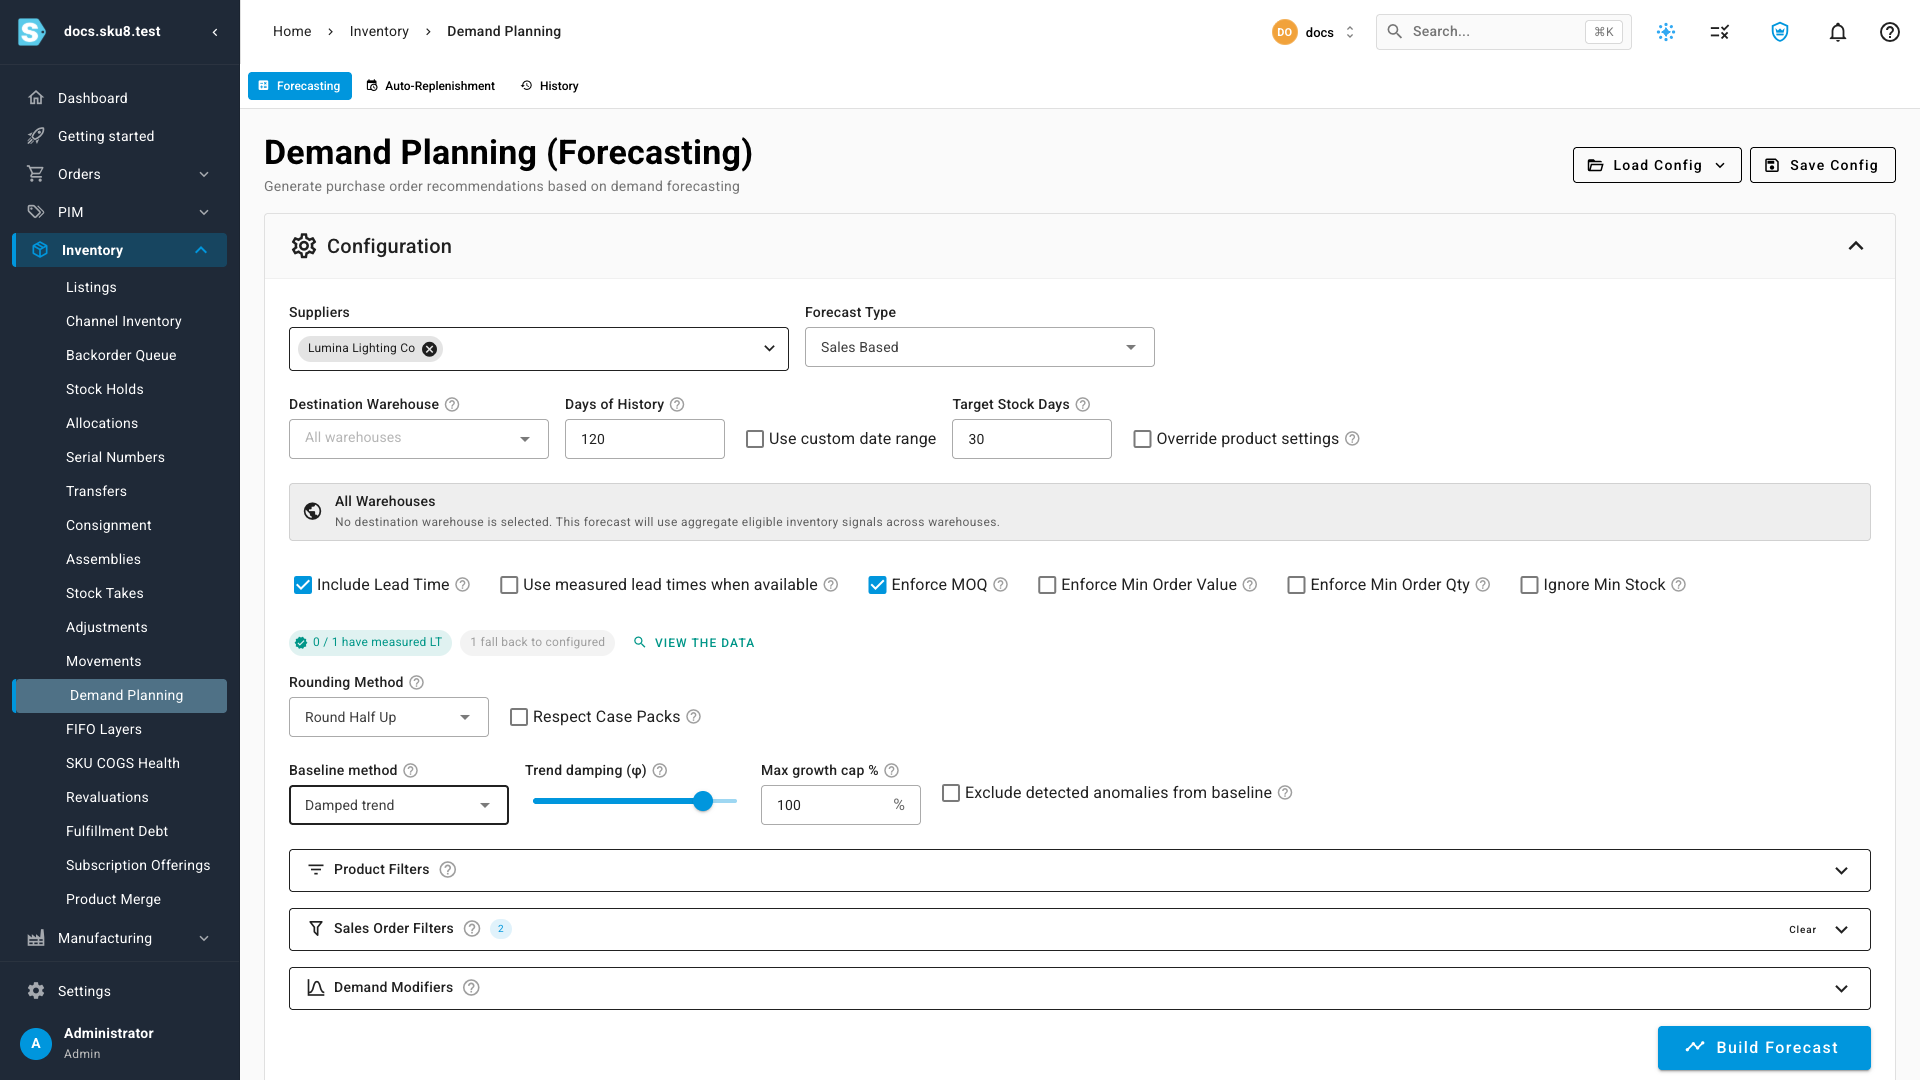
In the Configuration panel, find the Baseline method control:
- Flat mean — a plain average of the selected history (the classic behaviour).
- Recency-weighted — leans on your most recent sales.
- Damped trend — projects a product's recent growth forward, damped so a short-term spike can't run away with the order.
Choose Damped trend and two extra dials appear — Trend damping, which controls how strongly the trend carries forward, and a Max growth cap that limits how far a surge can lift the baseline. A separate Exclude detected anomalies from baseline option keeps one-off spikes — a past promotion, a data glitch — out of your everyday demand.
Build the forecast
- In Suppliers, choose the supplier to forecast — for this example, Lumina Lighting Co and its Festive Glow Lantern.
- Set Days of History to the window you want the baseline built from.
- Click Build Forecast.
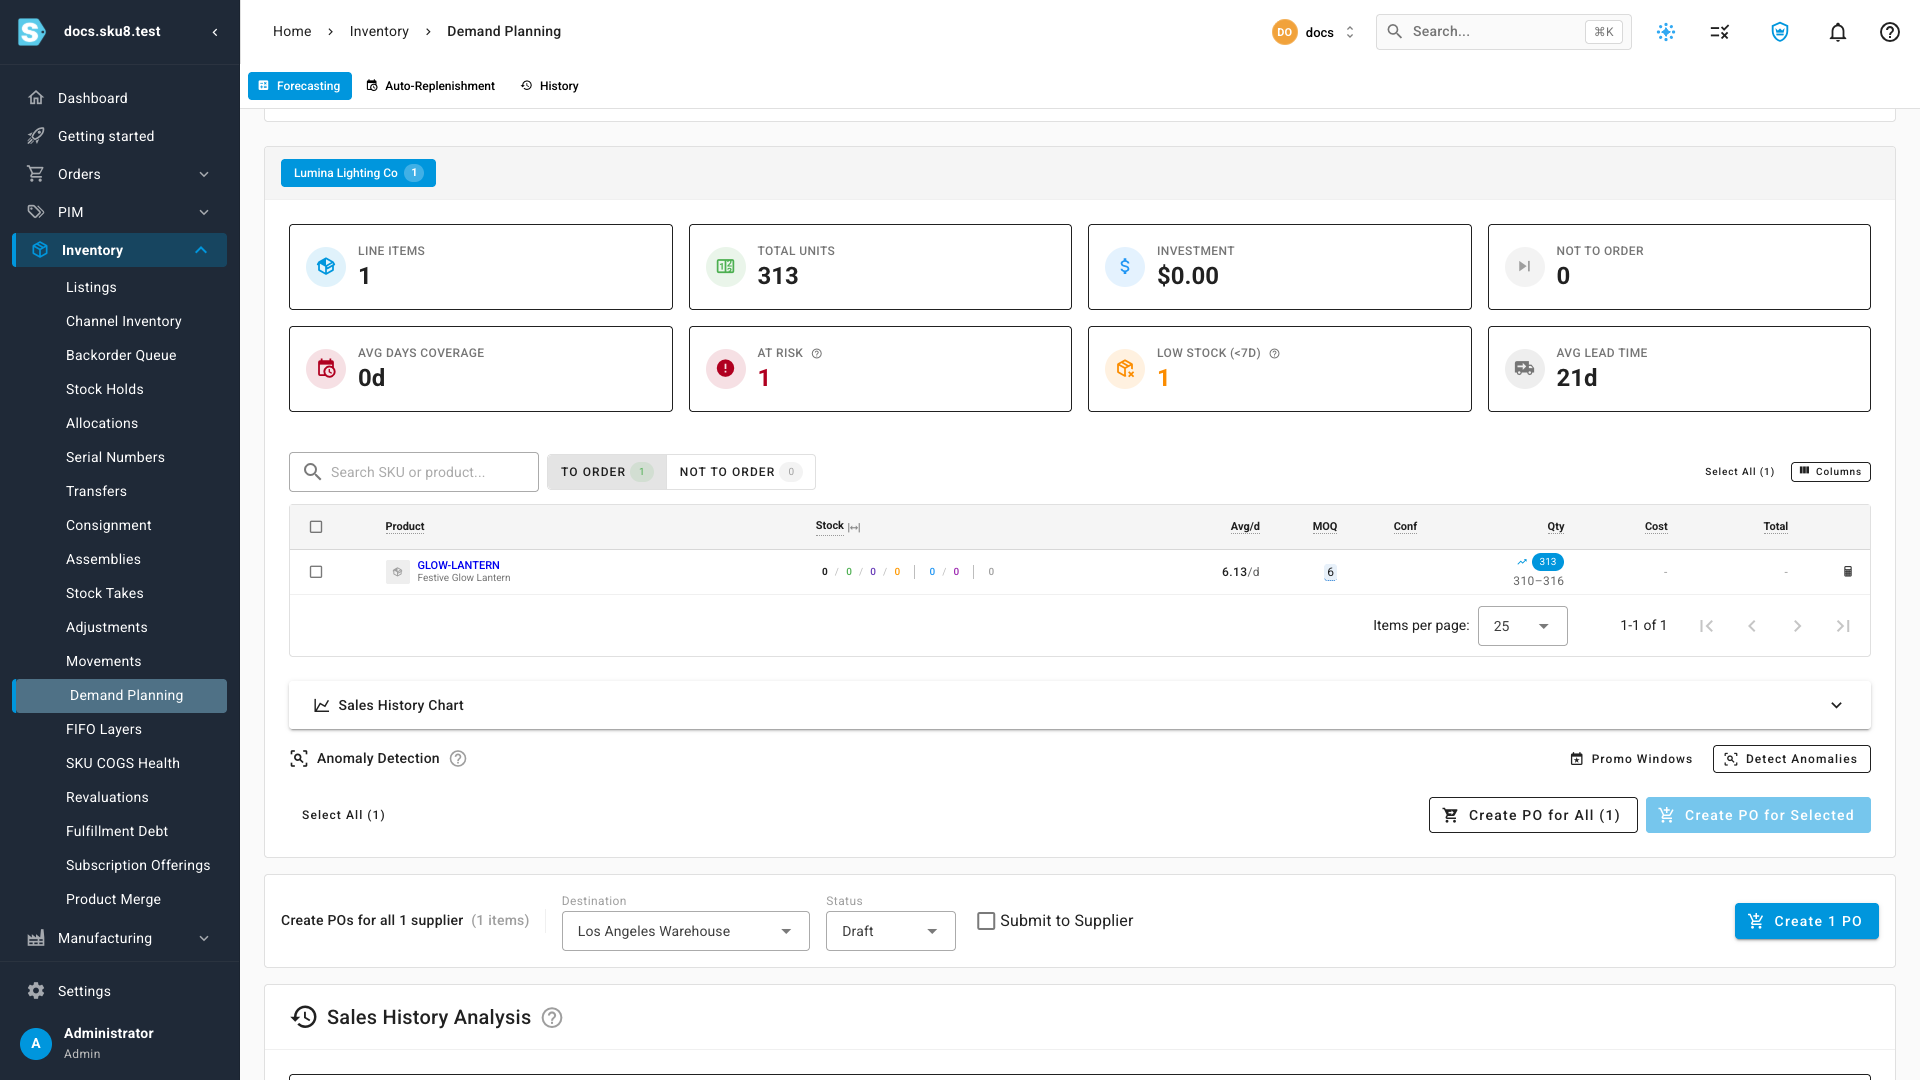
Each line's Avg/d now reflects its trend: this lantern has been growing, so damped trend reads it at about 6 a day — noticeably higher than the flat average of its slower earlier weeks. Every line also carries a confidence chip and a likely range under its recommended quantity.
See how the number is built
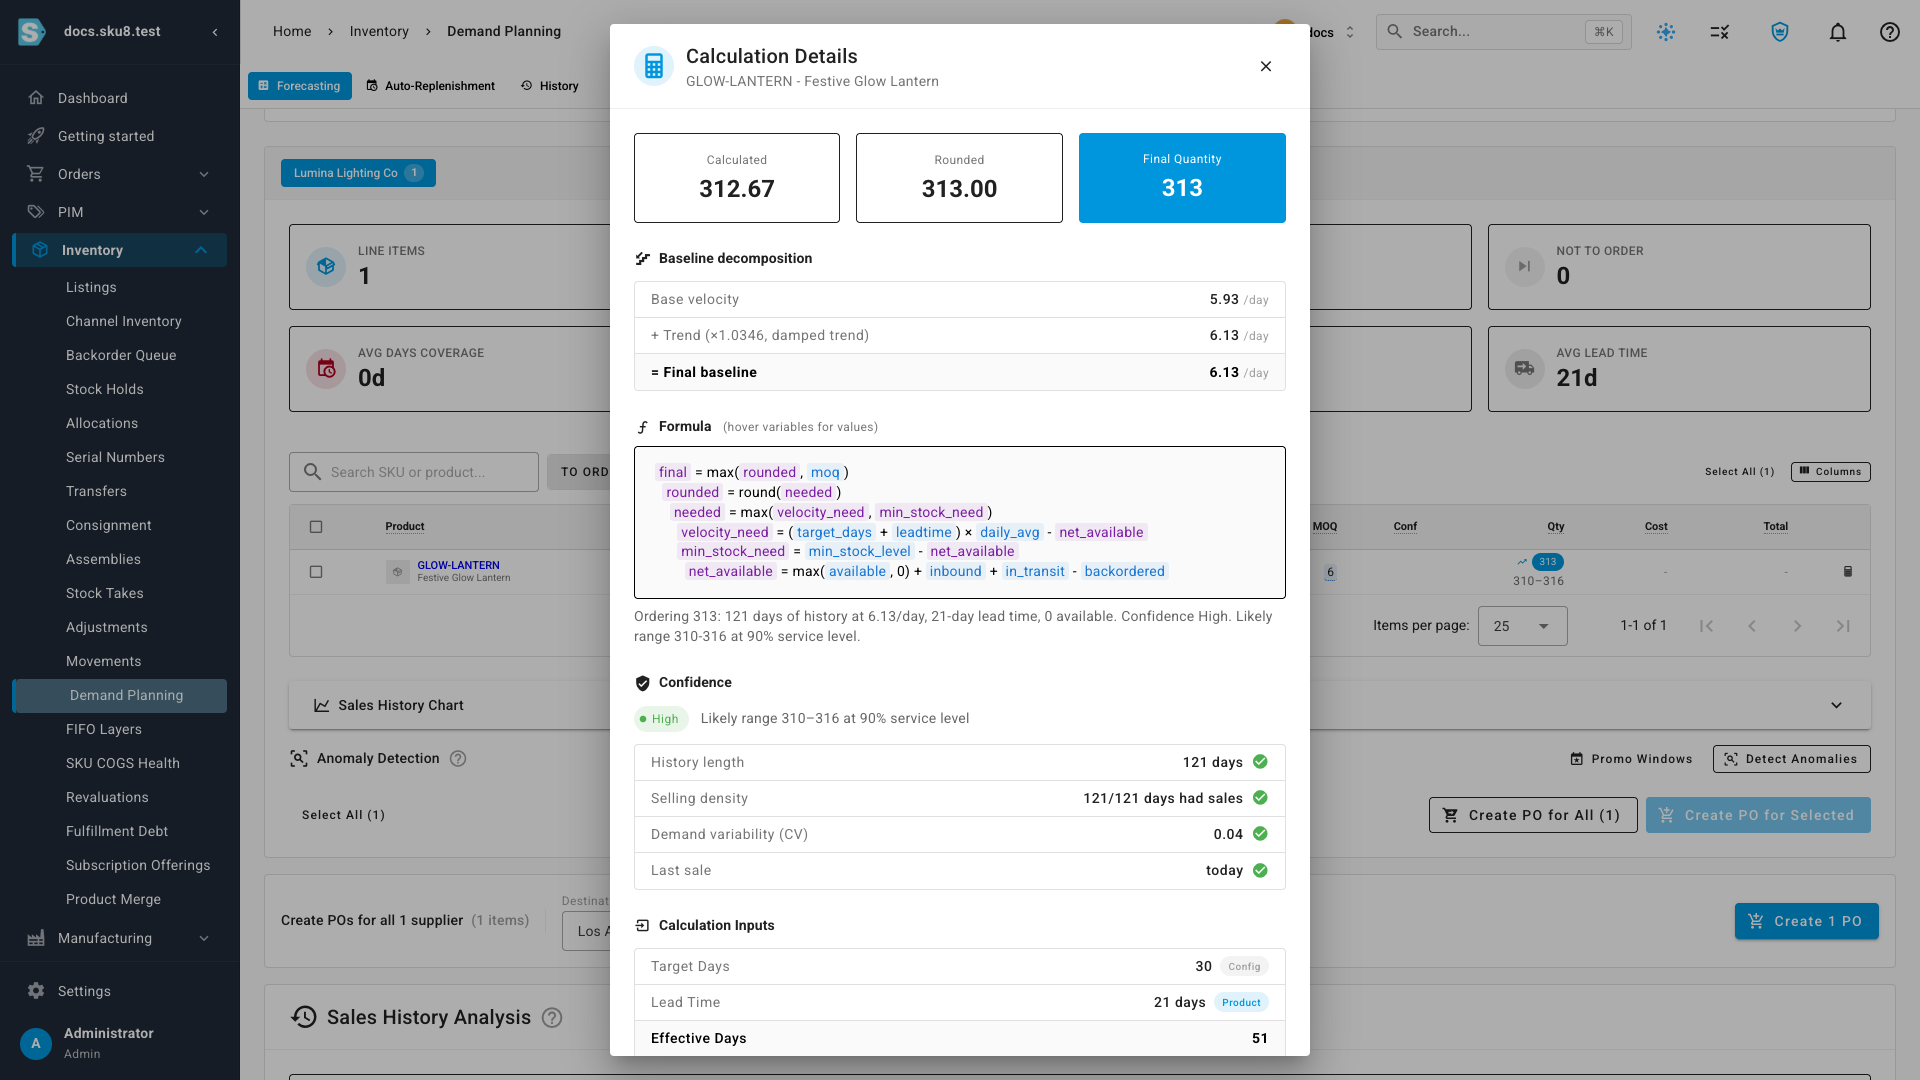
Click the calculator icon on any line to open its calculation detail. The new Baseline decomposition at the top shows, step by step:
- Base velocity — what the product would sell at, flat.
- + Trend — the multiplier the trend applied (and whether the growth cap kicked in).
- = Final baseline — the daily rate the order is actually built from.
So the reason behind every recommendation is right there, not hidden inside an average. Below it, the interactive formula and the confidence breakdown explain the rest of the calculation.
Re-use a promotion
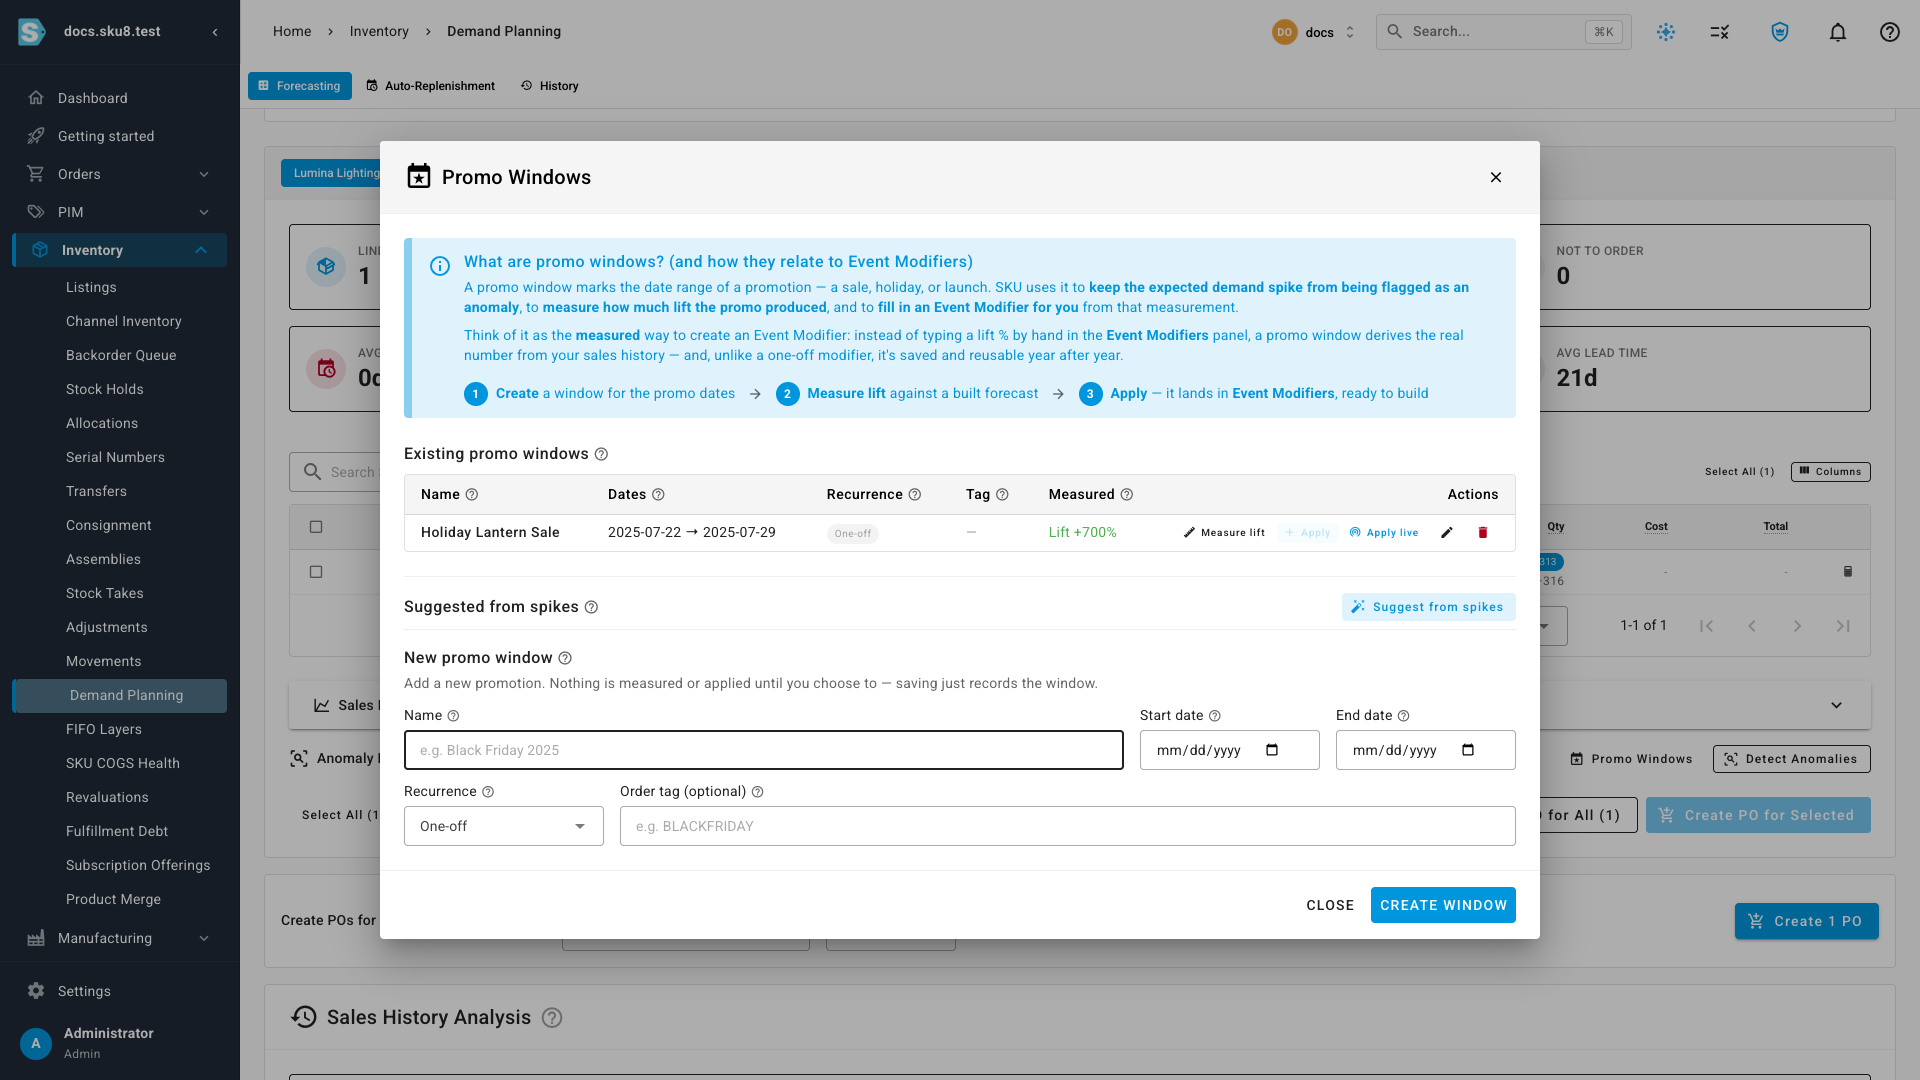
Ran a sale before and want to plan for it again? Open Promo Windows from the forecast results:
- Mark the promotion's dates — or click Suggest from spikes to have SKU propose them from your sales history.
- Click Measure lift to calculate how much the promotion lifted demand against your real history.
- Click Apply to add that lift to your forecast.
Because the lift is stored as a multiplier rather than a fixed number of units, it re-applies at today's volume automatically — a promotion that lifted demand 8× still lifts it 8× after your baseline has grown, with nothing to recalculate.
A holiday lantern sold about 2 a day a year ago. It has since tripled to about 6 a day, and last year's holiday drove an 8× spike. Because the measured promotion is a multiplier, planning this year's holiday layers it on today's larger baseline — 6/day × 8 ≈ 49/day, roughly 24× the two-a-day it launched at (3× growth × 8× holiday). You measure the promotion once, and the forecast rescales it every season as the product grows — exactly the flow the video walks through end to end.
Take the calculation with you
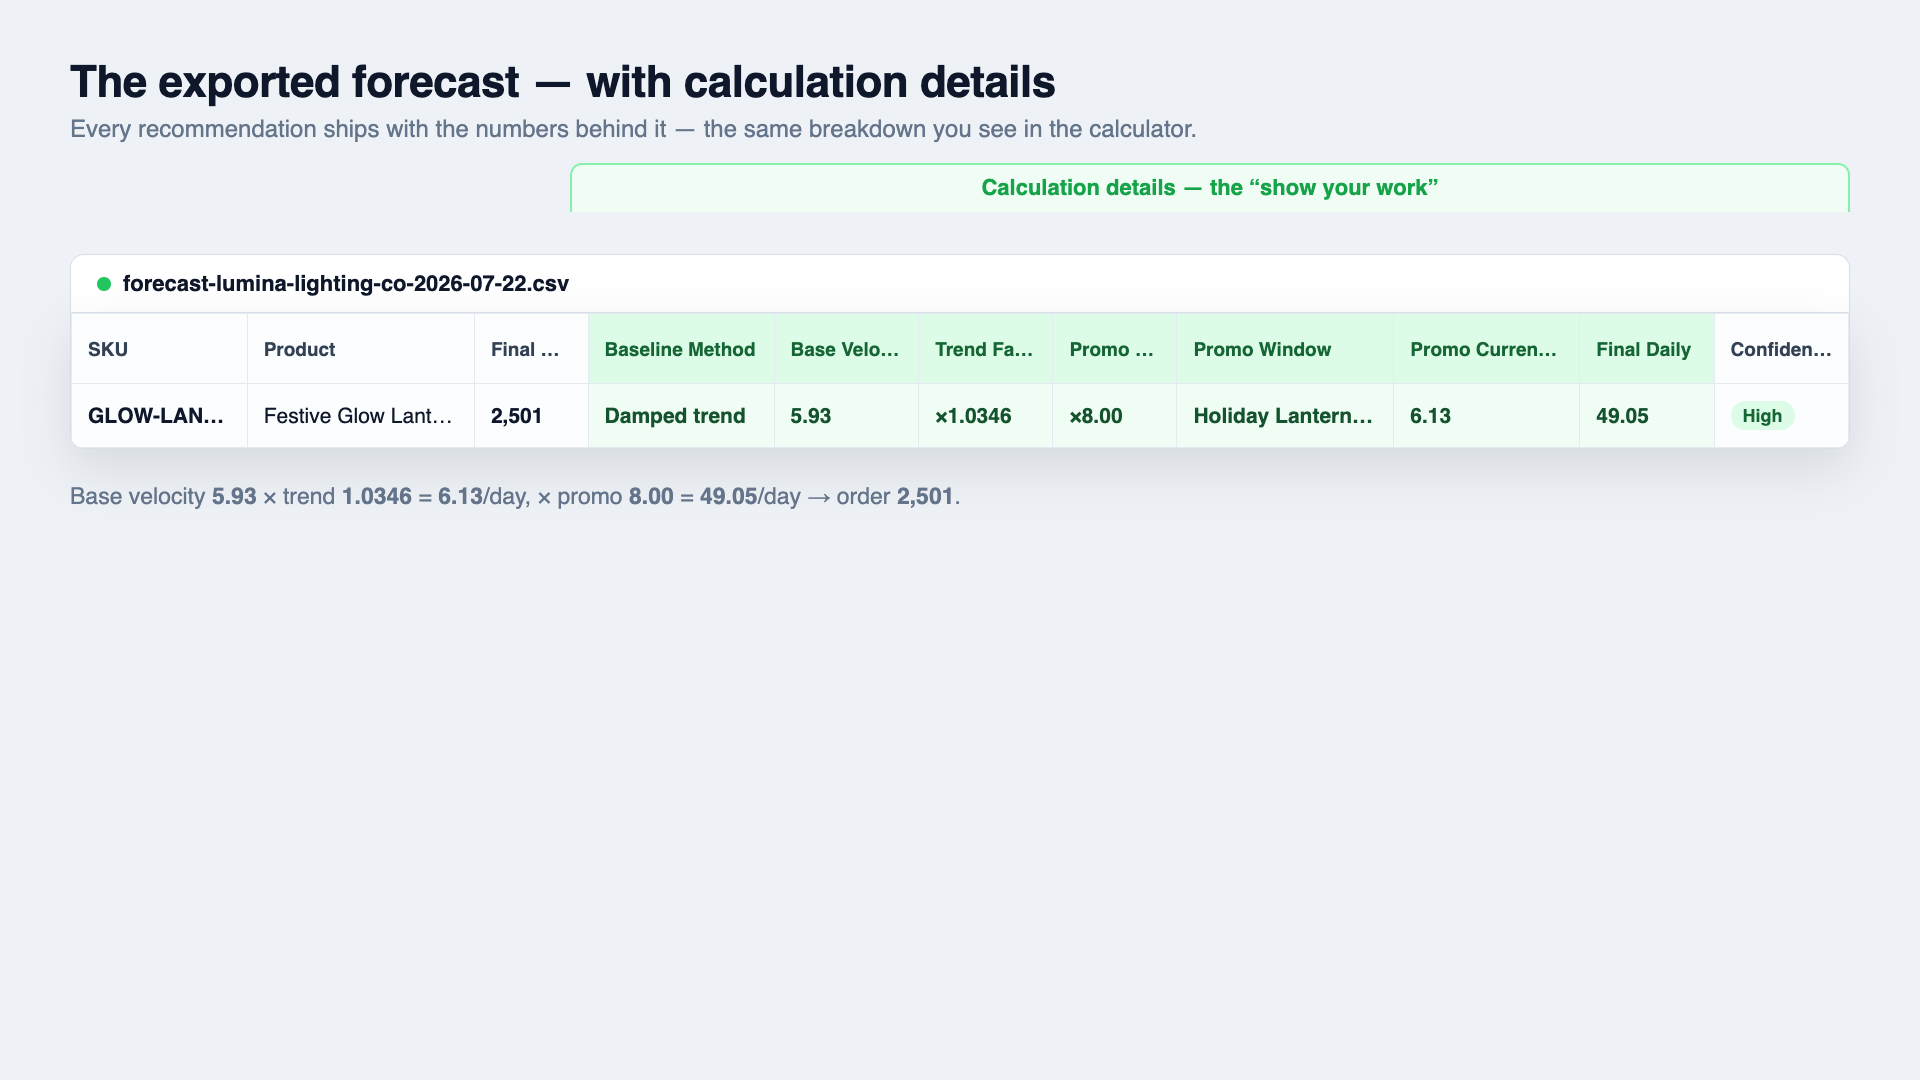
Every recommendation's work travels with your Export. Click Export, choose CSV or Excel, and keep Calculation details switched on. Each line then carries its full breakdown as columns — Base Velocity, Trend Factor (and whether the growth cap kicked in), Promo Factor, Promo Window, Promo Current Baseline, and the final daily rate — the same numbers you see in the calculator, ready to share or audit.
Next steps
- Not sure which numbers to trust? Each line's confidence tier and likely range tell you at a glance which recommendations to review.
- Prefer a flat average for steady sellers? Leave Baseline method on Flat mean — trend-aware forecasting is opt-in, product by product.